EFFECTIVE PERFORMANCE REPORTING
advertisement
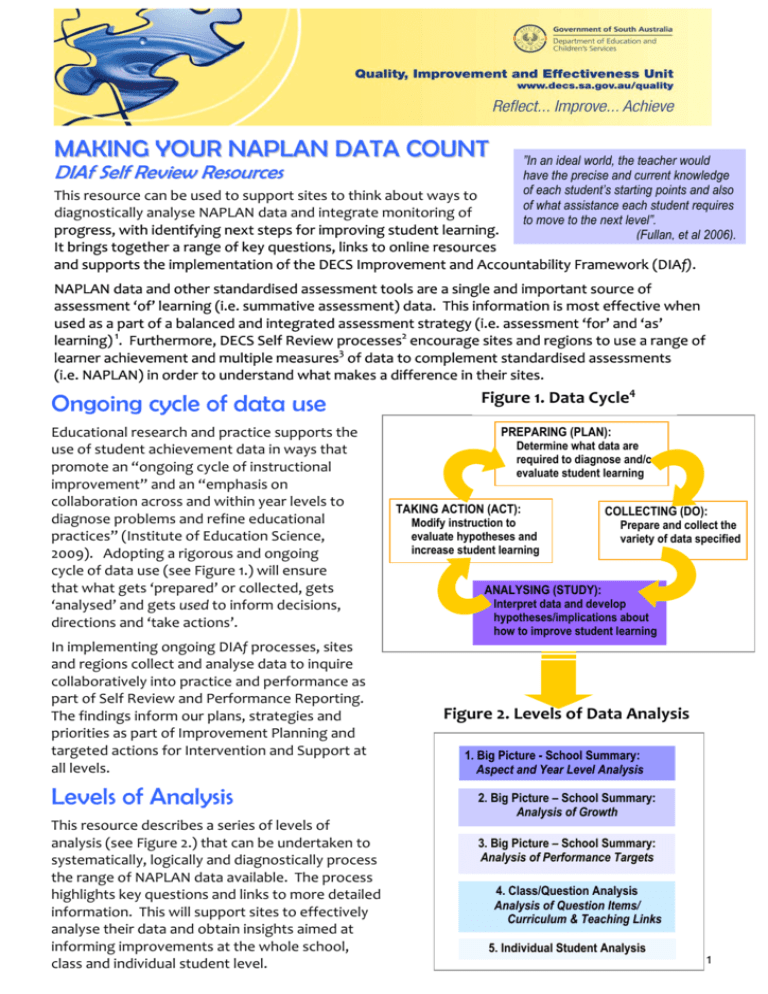
MAKING YOUR NAPLAN DATA COUNT ”In an ideal world, the teacher would have the precise and current knowledge of each student’s starting points and also This resource can be used to support sites to think about ways to of what assistance each student requires diagnostically analyse NAPLAN data and integrate monitoring of to move to the next level”. progress, with identifying next steps for improving student learning. (Fullan, et al 2006). DIAf Self Review Resources It brings together a range of key questions, links to online resources and supports the implementation of the DECS Improvement and Accountability Framework (DIAf). NAPLAN data and other standardised assessment tools are a single and important source of assessment ‘of’ learning (i.e. summative assessment) data. This information is most effective when used as a part of a balanced and integrated assessment strategy (i.e. assessment ‘for’ and ‘as’ learning) 1. Furthermore, DECS Self Review processes2 encourage sites and regions to use a range of learner achievement and multiple measures3 of data to complement standardised assessments (i.e. NAPLAN) in order to understand what makes a difference in their sites. Figure 1. Data Cycle4 PREPARING (PLAN): Educational research and practice supports the use of student achievement data in ways that Determine what data are required to diagnose and/or promote an “ongoing cycle of instructional evaluate student learning improvement” and an “emphasis on collaboration across and within year levels to TAKING ACTION (ACT): COLLECTING (DO): diagnose problems and refine educational Modify instruction to Prepare and collect the evaluate hypotheses and practices” (Institute of Education Science, variety of data specified increase student learning 2009). Adopting a rigorous and ongoing cycle of data use (see Figure 1.) will ensure that what gets ‘prepared’ or collected, gets ANALYSING (STUDY): Interpret data and develop ‘analysed’ and gets used to inform decisions, hypotheses/implications about directions and ‘take actions’. Ongoing cycle of data use In implementing ongoing DIAf processes, sites and regions collect and analyse data to inquire collaboratively into practice and performance as part of Self Review and Performance Reporting. The findings inform our plans, strategies and priorities as part of Improvement Planning and targeted actions for Intervention and Support at all levels. how to improve student learning Figure 2. Levels of Data Analysis 1. Big Picture - School Summary: Aspect and Year Level Analysis Levels of Analysis This resource describes a series of levels of analysis (see Figure 2.) that can be undertaken to systematically, logically and diagnostically process the range of NAPLAN data available. The process highlights key questions and links to more detailed information. This will support sites to effectively analyse their data and obtain insights aimed at informing improvements at the whole school, class and individual student level. 2. Big Picture – School Summary: Analysis of Growth 3. Big Picture – School Summary: Analysis of Performance Targets 4. Class/Question Analysis Analysis of Question Items/ Curriculum & Teaching Links 5. Individual Student Analysis 1 Levels of Analysis – Overview 1. Big Picture - School Summary: Aspect and Year Level Analysis ( Measures: Mean Scores, Prof. Bands, NMS) For examples or further information about this level of analysis access www.decs.sa.gov.au/quality > Self Review NAPLAN2011AnalysisResourcePresentation (slides 12-19) WHAT DO WE SEE IN THE DATA?5 What areas are your highest/lowest performing compared to national results over time? (i.e. compare your current year against previous years data available)? Compare your results to your Index Category results over time (and particular cohorts, where applicable e.g. ATSI, ESL). 2. Big Picture – School Summary: Analysis of Progress/Growth What areas are your highest/lowest performing in relation to growth over time? Compare your progress against your Index Category results? 3. Big Picture – School Summary: Analysis of Performance Targets Analyse your progress against performance targets or stated performance standards of achievement in your site improvement plan (where NAPLAN targets are indicated). 4. Class/Question Analysis Analysis of Question Items/ Curriculum and Teaching Links For examples and further information about this level of analysis go to www.decs.sa.gov.au/quality > Self Review NAPLAN2011AnalysisResourcePresentation (slides 21-27) What question items are most commonly answered correctly/incorrectly by year level (or class) compared to national results and/or index category over time? What does the analysis of other school assessment data highlight for the whole school, year or class level? How does this compare with the NAPLAN analysis? WHAT MIGHT WE DO ABOUT IT? WHY ARE WE SEEING WHAT WE ARE? What particular skills, aspects of the curriculum and teaching practices does the analysis indicate as possible areas of focus? Synthesis and Implications For examples and further information about this level of analysis go to www.decs.sa.gov.au/quality > Self Review NAPLAN2011AnalysisResourcePresentation (slides 32-34) What patterns emerge from the above analysis for the whole school, year or class level groupings? What are the next steps or implications for improvement planning at the whole school, year or class level groupings? Consider the implications for a whole school approach and the processes necessary for effective planning for improvement. What are the next steps or implications for pedagogy, curriculum and assessment for the whole school, year or class level? Consider what high leverage strategies, best practice or research might suggest about possible ways for how to improve student learning in the areas identified. 5. Individual Student Analysis For examples and further information about this level of analysis go to www.decs.sa.gov.au/quality > Self Review NAPLAN2011AnalysisResourcePresentation (slides28-31, 35) Which students performed higher or lower than expected? Why might this be so? Who needs extension or specific intervention and support based on this analysis? Which groups within classes would benefit from explicit instruction or extension in particular skills? 1 Earl, L., (2003), Assessment As learning, California: Corwin Press. 2 DECS Self Review Guide, pg 4, http://www.decs.sa.gov.au/quality 3 Bernhardt, V., (2004), Data Analysis for Continuous School Improvement (2nd Edition), Larchmont, NY: Eye on Education. 4 Institute of Education Science, (2009), Using Student Achievement Data to Support Instructional Decision Making. . 5 Principal as Literacy Leader (PALL) , National Pilot Project, Griffith University. 2
