Lab 6 RC Circuit
advertisement
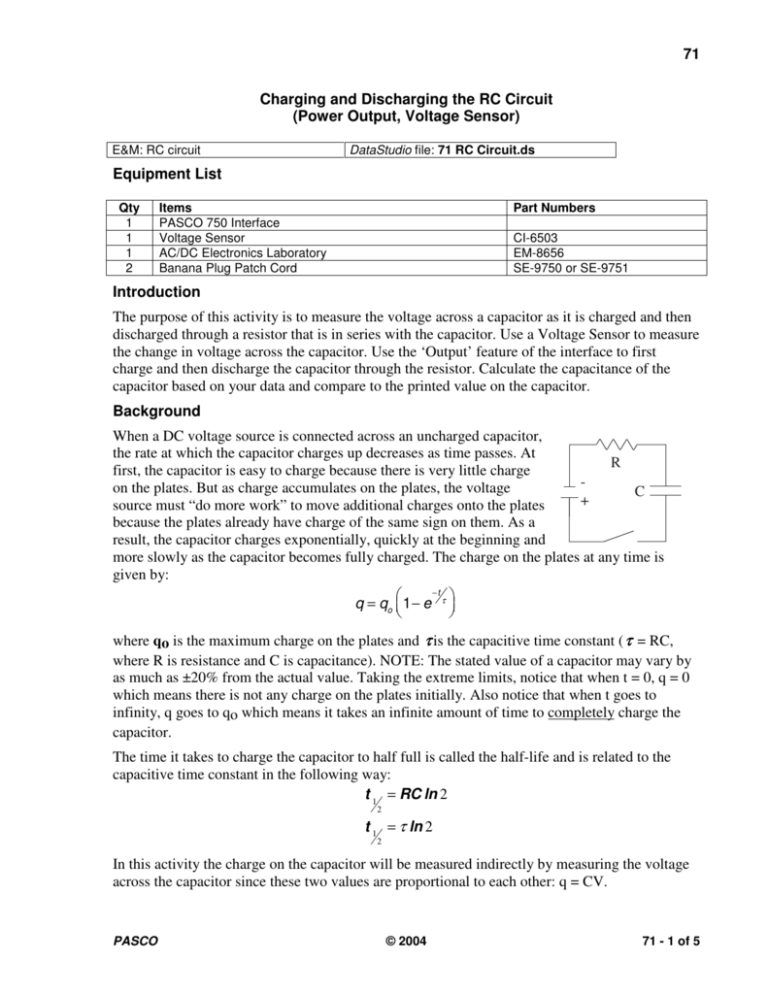
71 Charging and Discharging the RC Circuit (Power Output, Voltage Sensor) E&M: RC circuit DataStudio file: 71 RC Circuit.ds Equipment List Qty 1 1 1 2 Items PASCO 750 Interface Voltage Sensor AC/DC Electronics Laboratory Banana Plug Patch Cord Part Numbers CI-6503 EM-8656 SE-9750 or SE-9751 Introduction The purpose of this activity is to measure the voltage across a capacitor as it is charged and then discharged through a resistor that is in series with the capacitor. Use a Voltage Sensor to measure the change in voltage across the capacitor. Use the ‘Output’ feature of the interface to first charge and then discharge the capacitor through the resistor. Calculate the capacitance of the capacitor based on your data and compare to the printed value on the capacitor. Background When a DC voltage source is connected across an uncharged capacitor, the rate at which the capacitor charges up decreases as time passes. At R first, the capacitor is easy to charge because there is very little charge on the plates. But as charge accumulates on the plates, the voltage C + source must “do more work” to move additional charges onto the plates because the plates already have charge of the same sign on them. As a result, the capacitor charges exponentially, quickly at the beginning and more slowly as the capacitor becomes fully charged. The charge on the plates at any time is given by: −t q = qo 1− e τ where qo is the maximum charge on the plates and τ is the capacitive time constant ( τ = RC, where R is resistance and C is capacitance). NOTE: The stated value of a capacitor may vary by as much as ±20% from the actual value. Taking the extreme limits, notice that when t = 0, q = 0 which means there is not any charge on the plates initially. Also notice that when t goes to infinity, q goes to qo which means it takes an infinite amount of time to completely charge the capacitor. The time it takes to charge the capacitor to half full is called the half-life and is related to the capacitive time constant in the following way: t 1 = RC ln 2 2 t 1 = τ ln 2 2 In this activity the charge on the capacitor will be measured indirectly by measuring the voltage across the capacitor since these two values are proportional to each other: q = CV. PASCO © 2004 71 - 1 of 5 71 RC Circuit Physics Experiment Manual 012-09289 SAFETY REMINDER • Follow directions for using the equipment.. Setup 1. Set up the PASCO 750 Interface and computer and start DataStudio. 2. Connect the Voltage Sensor into the interface. Connect banana plug patch cords into the ‘OUTPUT’ ports on the PASCO 750 Interface. 3. Open the DataStudio file: 71 RC Circuit.ds • The file opens with a Graph display of voltage versus time and a Signal Generator window for controlling the output from the interface. • The Signal Generator is set to output a 4volt ‘positive only’ square wave at 0.100 Hz. The Signal Generator is set to ‘Auto’ so it will start and stop automatically when you start and stop measuring data. • Data recording is set to stop automatically after 20 seconds. 4. Set up the circuit shown in the illustration. Place a 1000-ohm resistor (brown, black, red) in the pair of spring clips nearest to the top banana jack at the lower right corner of the AC/DC Electronics Laboratory board. 5. Place a 330 microfarad (µF) capacitor in the pair of spring clips nearest the bottom banana jack on the board. Connect a wire lead between spring clips at the left end of the resistor and capacitor. 6. Put alligator clips on the Voltage Sensor leads and connect the alligator clips at each end of the capacitor. 7. Plug the banana plug patch cords from the ‘OUTPUT’ port of the PASCO 750 Interface into the banana jacks on the board. Procedure 1. In DataStudio, click ‘Start’ to begin recording data. • Watch the Graph display of voltage versus time. 71 - 2 of 5 © 2004 PASCO 012-09289 2. Physics Experiment Manual 71 RC Circuit Data recording will continue for 20 seconds and then stop automatically. Run #1 should appear in the Data list. Analysis 1. Rescale the Graph display if needed. 2. Expand a region of the Graph display. Use the ‘Zoom Select’ tool in DataStudio to click-anddraw a rectangle over a region of the plot of Voltage versus Time that shows the voltage rising from zero volts to the maximum volts. 3. Use the built-in analysis tools in the Graph display to find the time to ‘half-max’. • Click the ‘Smart Tool’. Move the cursor to the point on the plot where the voltage begins to rise. Drag the corner of the ‘Smart Tool’ to the point where the voltage is about 2 volts. The time to ‘half-max’ is the ‘x-coordinate’ 4. Record the time to ‘half-max’ in the Lab Report section. Use t 1 2 = τ ln2 = 0.693 x RC to calculate the capacitance (C) of the capacitor. PASCO Select a region to expand. © 2004 71 - 3 of 5 71 RC Circuit 71 - 4 of 5 Physics Experiment Manual © 2004 012-09289 PASCO 012-09289 Physics Experiment Manual 71 RC Circuit Lab Report: Charging and Discharging the RC Circuit Name: ________________________________________________________________ Data Time to half-max (t1/2) = __________ s Calculation 1. Calculate the capacitance of the capacitor: ( t 1 = τ ln 2 = RC ln 2 = RC 0.693 ) 2 t1 C= 2 ( R 0.693 Capacitance 2. ) = ___________ µF Determine the percent difference between the calculated capacitance and the value on the capacitor (330 µF): %diff = calculated − 330 µF × 100% = ___________% 330 µF Questions 1. The time to half-maximum voltage is how long it takes the capacitor to charge halfway. Based on your experimental results, how long does it take for the capacitor to charge to 75% of its maximum? 2. After four “half-lifes” (i.e., time to half-max), to what percentage of the maximum charge is the capacitor charged? 3. What is the maximum charge for the capacitor in this experiment? 4. What are some factors that could account for the percent difference between the stated and experimental values? PASCO © 2004 71 - 5 of 5
![Sample_hold[1]](http://s2.studylib.net/store/data/005360237_1-66a09447be9ffd6ace4f3f67c2fef5c7-300x300.png)
