System Modeling
advertisement
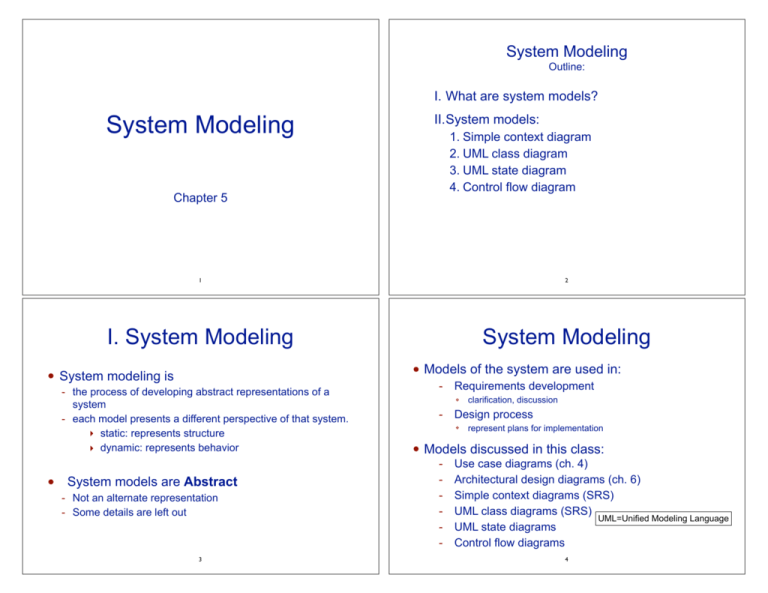
System Modeling Outline: I. What are system models? System Modeling II.System models: 1. Simple context diagram 2. UML class diagram 3. UML state diagram 4. Control flow diagram ! ! Chapter 5 !1 !2 I. System Modeling System Modeling • Models of the system are used in: • System modeling is - the process of developing abstract representations of a system - each model presents a different perspective of that system. ‣ static: represents structure ‣ dynamic: represents behavior • System models are Abstract - Not an alternate representation - Some details are left out !3 - Requirements development ❖ - clarification, discussion Design process ❖ represent plans for implementation • Models discussed in this class: - Use case diagrams (ch. 4) Architectural design diagrams (ch. 6) Simple context diagrams (SRS) UML class diagrams (SRS) UML=Unified Modeling Language UML state diagrams Control flow diagrams !4 II - 1.Simple Context Model • • Fig 5.1: The context of the MHC-PMS Used to define system boundaries - indicates what is done by the system being developed, and what will be done manually or by some other system «system» Management reporting system «system» Patient record system «system» Admissions system «system» MHC-PMS Represented as a box and line diagram: - • • • «system» HC statistics system Boxes show each of the systems involved Lines show interaction between systems System being developed is in the center «system» Appointments system «system» Prescription system !5 !6 From the BSU Online Bookstore SRS: Section 2.1 Product Perspective 2. UML Class Diagrams • • Static model: represents structure, NOT behavior • Uses: • Simple class diagrams: Arrowheads not necessary Database is often NOT external Include a diagram like this in your SRS !7 Shows object-oriented classes and associations between them - developing requirements: to model real-world objects during design phase: add implementation objects Box represents a class (with a name) Lines show associations between classes (name optional) Number at each end to show how many objects can be involved in the association (multiplicity) !8 Fig 5.8: UML Classes and association Patient Fig 5.9: Classes and associations in the MHC-PMS Consultant 1 1 Patient record 1 Condition Two classes and one association (a one-to-one relationship) • Each patient has 1 patient record • Each patient record belongs to 1 patient 1..* 1..* 1..* referred-to Patient diagnosedwith 1..* 1..* 1 1..* 1 1..* runs 1..4 Patient Course record Section referred-by prescribes 1..* 1..* prescribes Hospital Doctor Two classes and one association (a one-to-many relationship) • Each instructor teaches one or more course sections (1..*) • Each course section is taught by exactly 1 instructor. 1 General practitioner attends Consultation Instructor Patient 1..* 1..* Medication Treatment Condition - Patient is a many-to-many relationship • Each patient has one or more condition • Each condition may be had by one or more patients. !9 !10 Fig 5.10: Consultation class, in more detail Generalization (Inheritance) Class name Attributes, types are optional Operations, params + return types optional Consultation Doctors Date Time Clinic Reason Medication prescribed Treatment prescribed Voice notes Transcript ... New ( ) Prescribe ( ) RecordNotes ( ) Transcribe ( ) ... !11 The class box may also specify the attributes and operations of the class. • Act of identifying commonality among concepts, defining: - Note: Don’t record associated classes here (use arrows in the diagram) a general concept (base class) specialized concept(s) (derived class). • Common attributes are stored in superclass only - avoids duplication in diagram and code • UML class diagram: - Arrow points from derived classes to base class • Example: University personnel - Faculty, Staff, Students (graduate and undergrad) All university personnel have ID numbers All students have majors !12 Aggregation (composition) Fig 5.12: Generalization in UML class diagram • Doctor Attributes + operations of base class also belong to subclass objects (they are inherited) Name Phone # Email • register ( ) de-register ( ) Hospital doctor General practitioner Practice Address Staff # Pager # Derived class adds more specific attributes + operations • When objects are composed of separate parts - ex: a university class is composed of a faculty member and several students UML class diagram: - diamond at end of line closest to “whole” class When should you use a diamond? - to represent that one object is a “part of” another there is no formal definition. Hospital doctors have a phone # and a pager # !13 !14 Fig 5.13: Aggregation in UML class diagram From the BSU Online Bookstore SRS: Section 3.4 Logical Structure of the Data Class Patient record Section *1 1* 1 1..* Patient Faculty The * alone indicates “0 or more” Consultation Student !15 !16 From the BSU Online Bookstore SRS: Section 3.4 Logical Structure of the Data • Used to model “real world” objects during requirements engineering • • No operations indicated. • Attribute types are NOT from C++, they are more specific and more descriptive. Associations with multiplicity ARE indicated. - • • Some include constraints 3. UML State diagrams • • Dynamic model: represents behavior (not structure) • Useful when object/component/system is changed by events (real time and embedded systems, etc.) Describes - all the states an (object or component or system) can get into - how state changes in response to specific events (transitions) - mouse click on certain element - certain button is pushed - sensor reports a certain value Include a diagram like this in your SRS !17 !18 UML State diagrams Fig 5.16 State diagram of a microwave oven Full power Components of a state diagram: - Rounded rectangles: system states ‣ includes what action to do in that state - Labeled arrow: stimuli to force transition between states ‣ optional guard: transition allowed only when guard is true ‣ unlabeled arrow: transition occurs automatically when action is complete Full power do: set power = 600 Timer Waiting do: display time Half power Number Full power Half power Set time Operation do: get number exit: set time do: operate oven Door closed Timer Door open Half power do: set power = 300 Door closed Cancel Start Enabled do: display 'Ready' Door open Disabled do: display 'Waiting' Diagram is missing (at least) one arrow !19 !20 Waiting do: display time 4. Control Flow diagrams Control Flow diagrams aka Flowcharts • • Dynamic model: represents behavior (not structure) • Describes: Not a UML model (it’s old school) - the UML Activity diagram can model same information - the flow of control through an algorithm or process - branching using diamonds to represent decision points - repetition or looping using “back arrows” !21 control flow diagram: example !23 • Components of a control flow diagram: - Rounded rectangles: represent actions or processing ‣ input/output, storing/retrieving values, computation - Arrow: shows flow of control, where to go next ‣ may return to a previous action, forming a loop. - Diamond: contains yes/no question (or T/F) ‣ has two arrows coming out of it, one labeled “yes”, other labeled “no” - Start and end: rectangles indicating where algorithm starts and stops. !22

