Analyzations of Trombone and Vocals
advertisement
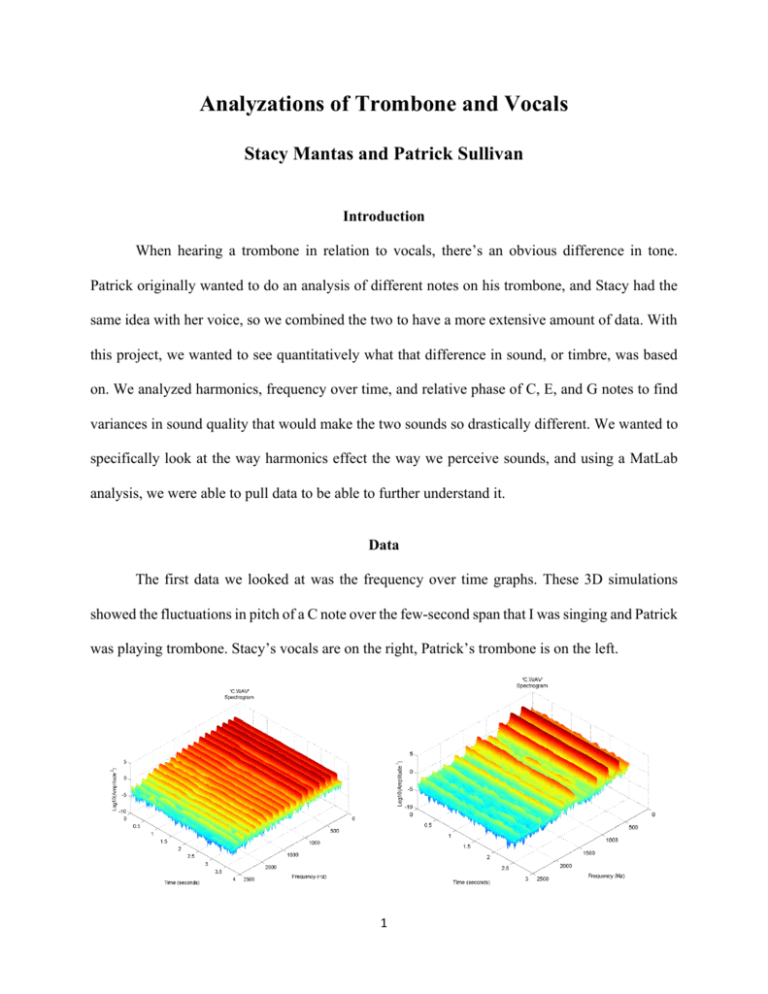
Analyzations of Trombone and Vocals Stacy Mantas and Patrick Sullivan Introduction When hearing a trombone in relation to vocals, there’s an obvious difference in tone. Patrick originally wanted to do an analysis of different notes on his trombone, and Stacy had the same idea with her voice, so we combined the two to have a more extensive amount of data. With this project, we wanted to see quantitatively what that difference in sound, or timbre, was based on. We analyzed harmonics, frequency over time, and relative phase of C, E, and G notes to find variances in sound quality that would make the two sounds so drastically different. We wanted to specifically look at the way harmonics effect the way we perceive sounds, and using a MatLab analysis, we were able to pull data to be able to further understand it. Data The first data we looked at was the frequency over time graphs. These 3D simulations showed the fluctuations in pitch of a C note over the few-second span that I was singing and Patrick was playing trombone. Stacy’s vocals are on the right, Patrick’s trombone is on the left. 1 The red areas of the graphs show strong, stable sound. Patrick’s trombone tended to give a more consistent sound compared to Stacy’s voice, which had a lower range of frequencies and at a lesser amplitude. We think this is because the trombone has less factors that would affect the way it resonates, which results in a clearer and more uniform sound. Because the human voice resonates in the chest, mouth, nasal cavities and so on, there’s bound to be less consistency in sound, whereas trombone resonates in a more closed space. We then looked at the harmonics of the E note to see which harmonics were dominant in each instrument. Patrick’s trombone is on the left while Stacy’s vocals are on the right: Patrick had more harmonics because he was playing his trombone an octave lower than Stacy was singing, so there was more reach to have higher harmonics. There was also a trend in the first three harmonics of decreasing presence. First, the notes don’t have the same fundamental frequency, as they’re being played at an octave apart. Both tones are complex, in that they’re made up of other simple tones that are harmonically related to each other. This is where the harmonic trend seen in the graph comes from—since both notes are iterations of the same tones, they share common harmonic qualities. Harmonics are based on the multiplication of oscillations of frequency, so the fundamental of Patrick playing middle E was 329.6 Hz, his second harmonic 2 would be double that at 659.2 Hz, and third harmonic at three times the oscillation of E at 988.8 Hz. The decreasing presence of the harmonics for both notes was indicative of their tonal relationship. One problem we ran into was the harmonic trends in C: I think we had issues while recording this note, because the harmonic trends are inconsistent with being the same note. Though they’re at different frequencies, the strength of the harmonics should be in line with each other. If we had had more time to re-record, I would’ve liked to go over this note one more time to make sure that these patterns were correct. We then pulled the phase diagrams of the notes to see where the amplitudes differed. The phase diagrams showed the height of sine graphs as vectors in polar units, as showed in the strength of harmonics in the graphs of C: 3 The fundamental is shown at 0, followed by a number of harmonics. As we stated before, Patrick had more harmonics because he played at a lower frequency, but Stacy also had less strength in hers. We think this is because Stacy sang at a lower amplitude than Patrick played trombone at and therefore, harmonics would be quieter. The relative size of the vectors is evidence for the lower amplitude. The location of the vectors, though, is much different. Stacy’s strongest harmonic, the second, was at 330˚, meaning it was close to the fundamental at 360˚. Patrick’s strongest harmonics, the fourth and fifth, were near 180˚. This shows the loudness of his harmonics being nearly opposite to the strength of the fundamental. Conclusion In conclusion, we were able to quantify the differences in timbre using graphical analysis. We looked especially at harmonics, which are the main difference-makers in the way we perceive sound. The rich, full sound of a trombone is reflective of the high number of harmonics it has, and strong lower harmonics is evidence for the brighter sound of the human voice. If we had had more time in the lab, we would’ve like to record our notes at the same frequency to have more valid data to see harmonics. Further, recording sharps and flats to see how they tonally compare to the natural tones would’ve given us a more holistic understanding of what timbre is and the effect it has on how we hear music. Overall, this project gave us more insight to why sounds are different, and both of us will take that knowledge with us into further exploration. 4

