- Bruce Hardie's
advertisement
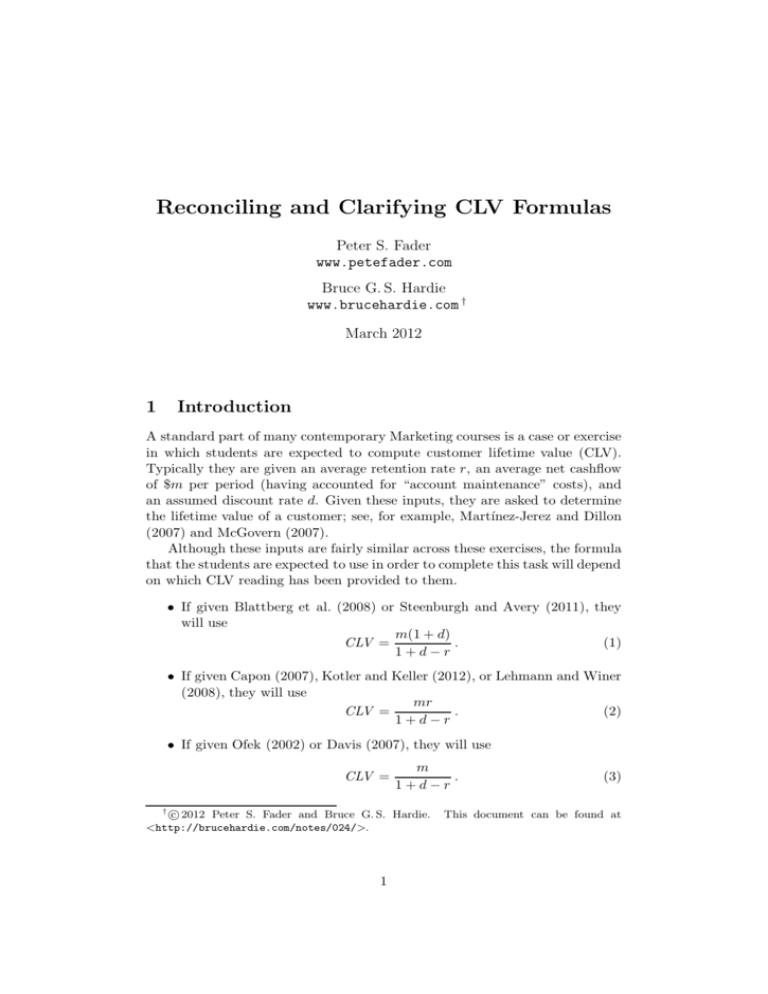
Reconciling and Clarifying CLV Formulas Peter S. Fader www.petefader.com Bruce G. S. Hardie www.brucehardie.com † March 2012 1 Introduction A standard part of many contemporary Marketing courses is a case or exercise in which students are expected to compute customer lifetime value (CLV). Typically they are given an average retention rate r, an average net cashflow of $m per period (having accounted for “account maintenance” costs), and an assumed discount rate d. Given these inputs, they are asked to determine the lifetime value of a customer; see, for example, Martı́nez-Jerez and Dillon (2007) and McGovern (2007). Although these inputs are fairly similar across these exercises, the formula that the students are expected to use in order to complete this task will depend on which CLV reading has been provided to them. • If given Blattberg et al. (2008) or Steenburgh and Avery (2011), they will use m(1 + d) CLV = . (1) 1+d−r • If given Capon (2007), Kotler and Keller (2012), or Lehmann and Winer (2008), they will use mr CLV = . (2) 1+d−r • If given Ofek (2002) or Davis (2007), they will use CLV = † m . 1+d−r c 2012 Peter S. Fader and Bruce G. S. Hardie. <http://brucehardie.com/notes/024/>. 1 (3) This document can be found at (In accounting for the differences in notation across the above references, customer acquisition costs have been excluded from these formulas.) What is rather disconcerting is that a large number of our colleagues around the world who are teaching customer lifetime value in Marketing courses are unaware of the existence of these “competing” formulas and therefore do not call attention to the interesting and important factors that underlie these differences. In this note, we cast light upon these differences and, in so doing, motivate the need for students to better understand what they are learning (and, in some cases, for professors to better understand what they are teaching). 2 Understanding the Different Formulas The answer to the question of which formula is the “correct” one depends on two factors: i) whether we include the customer’s first payment in the calculation, and ii) whether the net cashflow associated with each period is “booked” at the beginning or the end of the period. This leads to the three cases illustrated in Figure 1. Period 1 Period 2 ... Period 3 t=0 t=1 t=2 t=3 m m m m m m m Case 1: Case 2: m Case 3: m m Figure 1: Three CLV calculation scenarios Before we examine each scenario, let us note the basic mathematical result for an infinite geometric series which is used in all three cases: ∞ X n=0 kn = 1 , 0 < k < 1. 1−k (4) • Case 1: We receive $m when the “contract” with the customer is initiated (i.e., at time t = 0). The customer renews their contract at the beginning of Period 2 with probability r, in which case we immediately receive another $m, which we discount by 1/(1+d), and so on. Therefore, the expected customer lifetime value is computed as follows:1 1 Given the probabilistic nature of an individual’s “survival” as a customer to period t, we are computing the expected customer lifetime value (given the various underlying assumptions) and therefore write E(CLV ), not CLV . We strongly recommend this change of notation in all discussions and demonstrations of customer lifetime value. 2 mr mr 2 + +··· (1 + d) (1 + d)2 t ∞ X r E(CLV ) = m + =m t=0 1+d which, recalling equation (4) with k = r/(1 + d), = m(1 + d) . 1+d−r Ignoring acquisition costs, this quantity represents the expected lifetime value of an as-yet-to-be-acquired customer, and serves as an upper bound for how much we might be willing to spend in order to acquire a new customer. • Case 2: This is the same as Case 1 except that we do not include the initial net inflow of cash ($m) associated with the initiation of the customer relationship. The logic here is that the customer does not appear on the firm’s “radar” until after the first payment takes place, so the E(CLV ) calculation only begins after that transaction is “on the books.” Therefore, mr mr 2 + +··· (1 + d) (1 + d)2 t ∞ X r =m 1+d t=1 X t ∞ r =m −1 1+d t=0 mr = . 1+d−r E(CLV ) = This quantity can be viewed as the (residual ) lifetime value of a customer from whom we have just received the payment associated with any given period’s contract. Few of the readings noted above (or other CLV-related teaching resources) make any mention of this distinction between a customer’s full CLV (i.e., starting before the customer is “born” to the company) versus residual CLV, even though these are distinct concepts with different managerial applications. • Case 3: This is similar to Case 1, the difference being that the net cashflow associated with the initiation of the contract is received at the end of the contract period and is therefore discounted by 1/(1 + d). 3 The customer renews their contract with probability r, in which case we receive another $m at the end of period 2 (discounted by 1/(1 + d)2 ), and so on. Therefore, m mr + +··· (1 + d) (1 + d)2 X t ∞ m r = 1+d 1+d t=0 m = . 1+d−r E(CLV ) = Given its relationship with equation (1), this quantity would typically represent the expected lifetime value of an as-yet-to-be-acquired customer when the cashflows are assumed to arrive at the end of the period. Which of these formulas makes most sense is largely a matter of firm policy and the nature of the CLV-related problem being examined, not customer behavior, so students should be aware of this distinction if they plan to build strategies and tactics around CLV measurement. 3 Discussion The problem with many classroom discussions of CLV is that students are given equation (1), (2), or (3) as a “magic formula” (maybe coupled with a lookup table that provides a “margin multiplier” for different values of r and d) without any sense of what they are implicitly assuming when they use that formula (or lookup table). As a specific example, Capon (2007) proposes using equation (2) to determine an upper bound on acquisition spend, when clearly it should be based off equation (1). We therefore encourage instructors and students alike to first draw a diagram along the lines of Figure 1, so as to make explicit the assumptions concerning the nature and timing of cashflows for the problem being studied, and then derive the corresponding expression (or construct a spreadsheet to compute the quantity).2 Some readers may be thinking to themselves “Who cares? I simply want my students to understand the basic notion of customer lifetime value; it doesn’t really matter which formula I use, so long as they grasp the idea.” We completely disagree with this perspective. We have an obligation to teach students to think carefully about what they are actually computing. By not 2 This is especially important when the problem is a bit more complicated (e.g., there are differences in the timing of cash inflows and outflows) — see some of the examples given in Berger and Nasr (1998). 4 encouraging our students to do so, we only lower the reputation of marketers (in the eyes of finance and accounting professionals, who generally have a strong understanding of these issues) at a time when we are crying out for more credibility. We close by raising two additional issues that should be taken into account — and, ideally, explicity discussed — in any classroom discussion of CLV. 3.1 The Reality of Non-constant Retention Rates The formulas given in equations (1)–(3) all assume a constant retention rate r. At first glance, this may not seem to be a problem as we often observe relatively constant retention rates in company-reported summaries. In contrast, however, when we track a cohort of customers over time, we do not observe a constant retention rate; rather, we find that the retention rates tend to increase over time — quite systematically and often quite dramatically. The relatively constant retention rates observed in the company-reported summaries are in fact a result of aggregation across cohorts of customers. New customers (with relatively low retention rates) are being averaged in with existing customers, thereby masking the pattern (of increasing retention rates over time) that we would likely see for any given cohort by itself. At the heart of the derivations of equations (1)–(3) is r t , which is the probability that the customer “survives” beyond t periods. Given that observed cohort-level retention rates are not constant, we need to replace r t with Qt i=0 ri where ri is the retention rate for period i (and r0 = 1). As a result, we do not get clean closed-form expressions for E(CLV ) of the form given in equations (1)–(3). Furthermore, there is the added complication that we need to project retention rates into the future. (See Fader and Hardie (2007) for a discussion of how to do this, and Fader and Hardie (2010) for a discussion of how to compute CLV given such projections.) As we explore in Fader and Hardie (2010), a failure to account for these cohort-level dynamics will result in systematically biased estimates of CLV. The effect will be relatively small in magnitude for new customers, but it can be quite large (easily on the order of 50–60%) for existing customers. This can have a tremendous impact when computing the residual value of an entire customer base (e.g., for M&A activities). We therefore conclude that the formulas given in equations (1)–(3) are of limited use in real-world settings because of their assumption of a constant retention rate. We feel that teachers are doing their students a disservice by teaching them the concepts of CLV using these highly stylized expressions without introducing them to realities such as non-constant retention rates — and the important implications associated with them. 5 3.2 Contractual vs. Noncontractual Settings Finally, even if we ignore the above point, it must be noted that these expressions only apply in contractual settings. In such settings, the “loss” of a customer is observed. For example, the customer has to contact the firm to cancel her cable TV contract; similarly, a magazine publisher can observe that a subscriber has not renewed his annual subscription. In such settings, it is meaningful to talk about (and therefore compute) retention rates, and all of the issues described above are applicable. But for many businesses, (e.g., mail-order companies and hotel chains, among countless others), the time at which a customer is “lost” is not observed by the firm. (Does the lack of purchasing by a customer mean they have decided to end their “relationship” with the firm or are they simply in the midst of a long hiatus between transactions?) In these noncontractual settings, it is meaningless to talk about observed retention rates, which means the above CLV expressions are of no use whatsoever. One can talk about a repeat-buying rate, but that has nothing in common with a retention rate — it simply reflects the “presence/absence” of purchasing activities as opposed to the observed “survival/death” that is associated with the notion of a contractual relationship. To be very specific, the r t component of the contractual CLV formulas is completely meaningless in a noncontractual setting when the observed repeat-buying rate is treated as a retention rate. Unfortunately this critical issue is not covered in most CLV-related readings targeted at students or managerial audiences. Once again, teachers generally offer an oversimplified “one size fits all” characterization of CLV, which harms students’ ability to truly understand and make productive use of this concept.3 Even popular teaching materials, and papers and books by well-regarded scholars fall into this trap: • The example given in the HBS Note “Customer Profitability and Lifetime Value” (Ofek 2002) is one of a direct catalog retailer — a noncontractual setting — and what must be a repeat-buying rate is reported as a retention rate and used in a formula equivalent to equation (3). • The setting for the HBSP Case “Rosewood Hotels & Resorts” (Dev and Stroock 2007) is hotels, which is clearly noncontractual in nature. The teaching note interprets what is clearly a repeat-buying rate as a retention rate, and the associated spreadsheet (Steenburgh and Avery 2010) sees students computing CLV using a formula equivalent to equation (1). • The award-winning paper by Gupta et al. (2004), along with Gupta and Lehmann (2005), has done a great job of popularizing CLV and 3 This contractual vs. noncontractual distinction, and the associated implications for computing CLV, is explored in Fader and Hardie (2009). 6 showing its direct relevance to corporate valuation activities. This paper demonstrates how CLV can be used to obtain an overall valuation for five different firms by leveraging the logic behind equation (1). Three of these firms (Ameritrade, Capital One, and E*Trade) are contractual and the CLV-based model provides good approximations for each firm’s observed market value. But two other firms (Amazon and E-Bay) represent noncontractual settings and, not surprisingly, the incorrect use of a repeat-buying rate as a retention rate certainly helps explain why the CLV-based valuations are way off the mark. (Why ruin an otherwise worthwhile exercise by applying the wrong tool at the wrong time?) It is not our objective here to “call out” any colleagues in particular for the way they cover customer lifetime value in their teaching and research activities — the concerns described here are endemic to the entire field of marketing. Instead, our goal is to help and encourage everyone in the field to be a little more careful about what we say and do with CLV. Many of our students enjoy learning about this concept and perceive it to be among the most valuable “takeaways” from their marketing courses. Let us enhance their learning and make it more possible for them to bring CLV to life — in the correct manner — after they graduate. 7 References Berger, Paul D. and Nada I. Nasr (1998), “Customer Lifetime Value: Marketing Models and Applications,” Journal of Interactive Marketing, 12 (Winter), 17–30. Blattberg, Robert C., Byung-Do Kim, and Scott A. Neslin (2008), Database Marketing: Analyzing and Managing Customers, New York: Springer. Capon, Noel (2007), Managing Marketing in the 21st Century, Bronxvile, NY: Wessex. Davis, John (2007), Measuring Marketing: 103 Key Metrics Every Marketer Needs, Singapore: John Wiley & Sons (Asia). Dev, Chekitan S. and Laure Mougeot Stroock (2007), “Rosewood Hotels & Resorts: Branding to Increase Customer Profitability and Lifetime Value,” Harvard Business Publishing HBP No. 2088 (June 15, 2007). Fader, Peter S. and Bruce G. S. Hardie (2007), “How to Project Customer Retention,” Journal of Interactive Marketing, 21 (Winter), 76–90. Fader, Peter S. and Bruce G. S. Hardie (2009), “Probability Models for CustomerBase Analysis,” Journal of Interactive Marketing, 23 (January), 61–69. Fader, Peter S. and Bruce G. S. Hardie (2010), “Customer-Base Valuation in a Contractual Setting: The Perils of Ignoring Heterogeneity,” Marketing Science, 29 (January–February), 85–93. Gupta, Sunil and Donald R. Lehmann (2005), Managing Customers as Investments, Upper Saddle River, NJ: Wharton School Publishing. Gupta, Sunil, Donald R. Lehmann, and Jennifer Ames Stuart (2004), “Valuing Customers,” Journal of Marketing Research, 41 (February) 7–18. Kotler, Philip and Kevin Lane Keller (2012), Marketing Management (14th edn), Upper Saddle River, NJ: Prentice Hall. Lehmann, Donald R. and Russell S. Winer (2008), Analysis for Marketing Planning (7th edn), New York, NY: McGraw-Hill/Irwin. Martı́nez-Jerez, F. Ası́s and James R. Dillon (2007), “Kansai Digital Phone: Zutto, Gaining Japanese Loyalty,” Harvard Business School Case 9-106-006 (rev. March 27, 2007). McGovern, Gail (2007), “Virgin Mobile USA: Pricing for the Very First Time,” Harvard Business School Case 9-504-028 (rev. June 11, 2007). Ofek, Elie (2002), “Customer Profitability and Lifetime Value,” Harvard Business School Note 9-503-019 (rev. August 7, 2002). 8 Steenburgh, Thomas J. and Jill Avery (2010), “Marketing Analysis Toolkit: Customer Lifetime Value Analysis (CW),” Harvard Business School Spreadsheet Supplement 511-702. Steenburgh, Thomas and Jill Avery (2011), “Marketing Analysis Toolkit: Customer Lifetime Value Analysis,” Harvard Business School Note 9-511-029 (rev. August 12, 2011). 9

