Graphing Motion Lab
advertisement
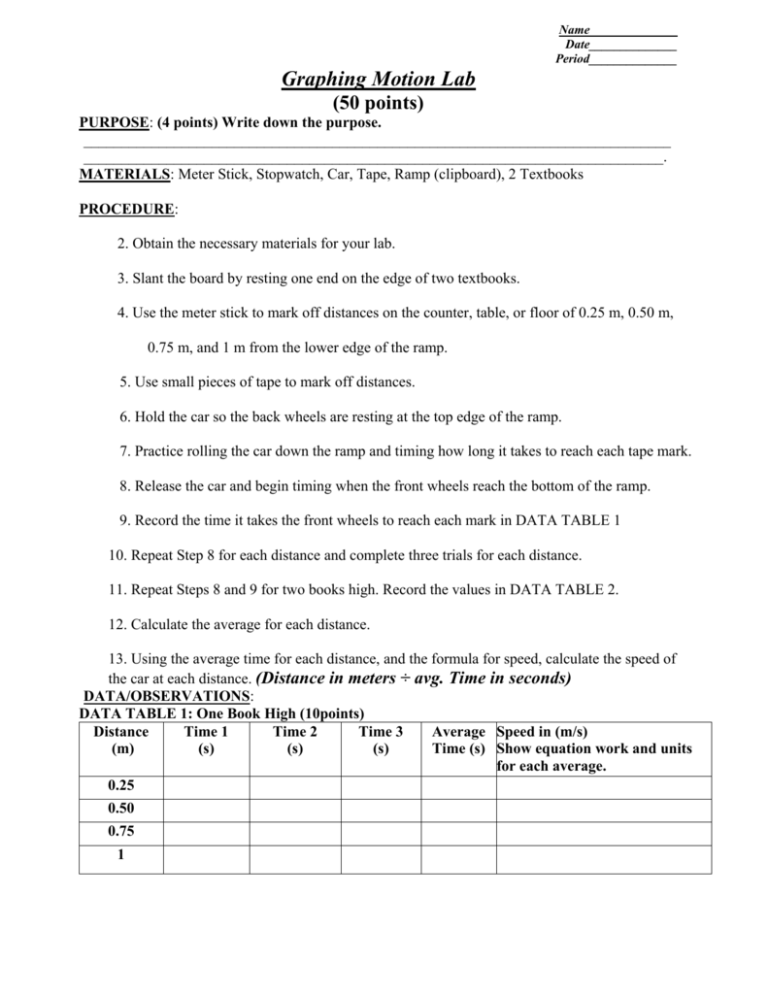
Name______________ Date______________ Period______________ Graphing Motion Lab (50 points) PURPOSE: (4 points) Write down the purpose. ______________________________________________________________________________ _____________________________________________________________________________. MATERIALS: Meter Stick, Stopwatch, Car, Tape, Ramp (clipboard), 2 Textbooks PROCEDURE: 2. Obtain the necessary materials for your lab. 3. Slant the board by resting one end on the edge of two textbooks. 4. Use the meter stick to mark off distances on the counter, table, or floor of 0.25 m, 0.50 m, 0.75 m, and 1 m from the lower edge of the ramp. 5. Use small pieces of tape to mark off distances. 6. Hold the car so the back wheels are resting at the top edge of the ramp. 7. Practice rolling the car down the ramp and timing how long it takes to reach each tape mark. 8. Release the car and begin timing when the front wheels reach the bottom of the ramp. 9. Record the time it takes the front wheels to reach each mark in DATA TABLE 1 10. Repeat Step 8 for each distance and complete three trials for each distance. 11. Repeat Steps 8 and 9 for two books high. Record the values in DATA TABLE 2. 12. Calculate the average for each distance. 13. Using the average time for each distance, and the formula for speed, calculate the speed of the car at each distance. (Distance in meters ÷ avg. Time in seconds) DATA/OBSERVATIONS: DATA TABLE 1: One Book High (10points) Distance Time 1 Time 2 Time 3 Average Speed in (m/s) (m) (s) (s) (s) Time (s) Show equation work and units for each average. 0.25 0.50 0.75 1 DATA TABLE 2: Two Books High (10 points) Distance Time 1 Time 2 Time 3 (m) (s) (s) (s) Average Speed in (m/s) Time (s) Show equation work and units for each average. 0.25 0.50 0.75 1 Conclusion Questions: (show your work, the equation and units for full credit) 1. How is speed different than velocity? (2 points) ______________________________________________________________________________ _____________________________________________________________________________. 2. If your car had an average velocity of 3.4m/s, how long would it take to travel 11 meters? Show your work, the equation and your units. (4 points) ______________________________________________________________________________ _____________________________________________________________________________. 3. Use at least ½ page for your graph. Figure out what your Independent Variable is and your Dependent Variable is and label your X and Y axis properly. Graph the speed of the car for both heights; one book high and two books high. You should have one graph with two lines, and make a key. (10 points) 4. Calculate the slope of the line for one book high and two books high. Use points on the graph from .25 to 1 meter to calculate slope. Show your work, the equation and your units. (8 points) ______________________________________________________________________________ ______________________________________________________________________________ ______________________________________________________________________________ ______________________________________________________________________________ 5. What happens to the speed of the car as it travels over the entire distance? (2 points) ______________________________________________________________________________ _____________________________________________________________________________.
