What's happened since the IPO?
advertisement
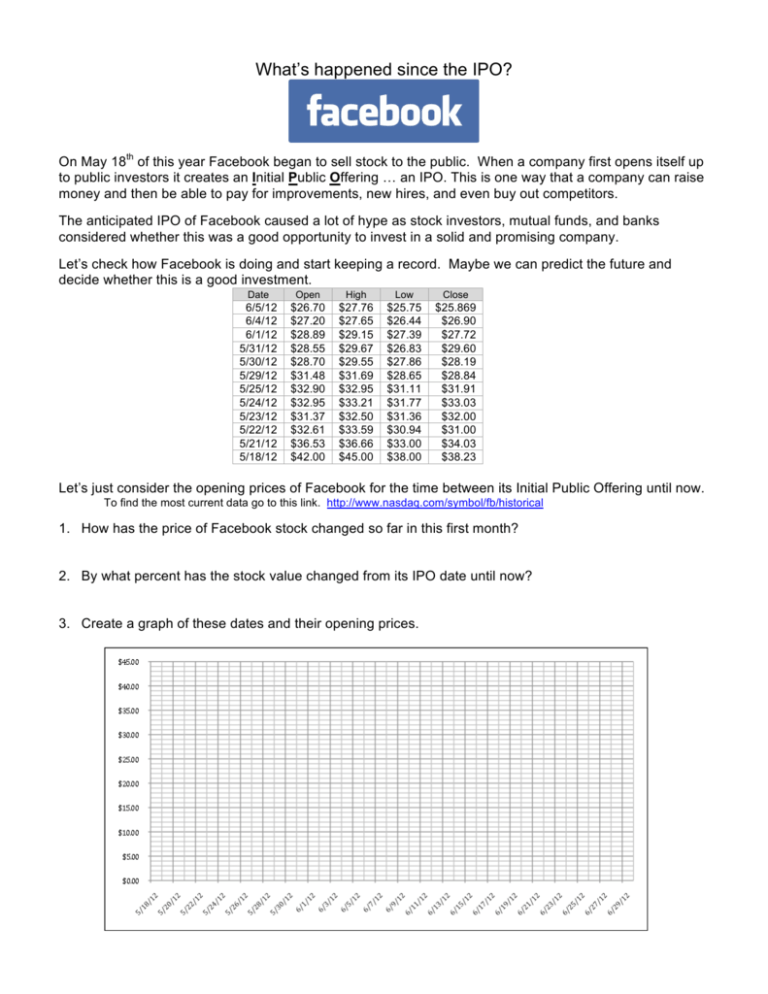
What’s happened since the IPO? On May 18th of this year Facebook began to sell stock to the public. When a company first opens itself up to public investors it creates an Initial Public Offering … an IPO. This is one way that a company can raise money and then be able to pay for improvements, new hires, and even buy out competitors. The anticipated IPO of Facebook caused a lot of hype as stock investors, mutual funds, and banks considered whether this was a good opportunity to invest in a solid and promising company. Let’s check how Facebook is doing and start keeping a record. Maybe we can predict the future and decide whether this is a good investment. Date Open High Low Close 6/5/12 6/4/12 6/1/12 5/31/12 5/30/12 5/29/12 5/25/12 5/24/12 5/23/12 5/22/12 5/21/12 5/18/12 $26.70 $27.20 $28.89 $28.55 $28.70 $31.48 $32.90 $32.95 $31.37 $32.61 $36.53 $42.00 $27.76 $27.65 $29.15 $29.67 $29.55 $31.69 $32.95 $33.21 $32.50 $33.59 $36.66 $45.00 $25.75 $26.44 $27.39 $26.83 $27.86 $28.65 $31.11 $31.77 $31.36 $30.94 $33.00 $38.00 $25.869 $26.90 $27.72 $29.60 $28.19 $28.84 $31.91 $33.03 $32.00 $31.00 $34.03 $38.23 Let’s just consider the opening prices of Facebook for the time between its Initial Public Offering until now. To find the most current data go to this link. http://www.nasdaq.com/symbol/fb/historical 1. How has the price of Facebook stock changed so far in this first month? 2. By what percent has the stock value changed from its IPO date until now? 3. Create a graph of these dates and their opening prices. Pretend that you bought shares of Facebook stock on May 18, 2012 at the opening price of $42.00 per share. 4. How much did you invest? a. For 100 shares b. For 1,000 shares 5. What would your stock be worth today? a. For 100 shares b. For 1,000 shares 6. What did you notice about your investment? I was thinking about investing in Facebook. I thought the stock value would surely go up because I thought people always make money by investing in IPO's. I decided to do some research and look at other IPO's in recent history. For each of the following IPO initial year of results, tell what you see, think or wonder. Make some observations to share with the class. a. Google (GOOG) is very successful. Its IPO date was August 14, 2005 with a price per share of $85. Here is a chart I found that shows Google’s progress for its first year of pubic offering. b. Zipcar (ZIP) created its IPO on April 14, 2011 with an opening share of $28.00. Below is a chart of Zipcar’s first year of public trading. c. I’m not sure how valuable the stock Rosetta Stone (RST) will become. It’s IPO date was Apr 16, 2009 with an initial share price of $18. Below is a chart of its first year’s progress. d. Netflix (NFLX) became a publicly traded company on May 24, 2002. It’s IPO price was $15 and below is a chart of its first year’s progress. After examining these IPO opening year charts, think about and explain your reasoning of the following. a. Was I correct in assuming that IPO's are usually moneymakers? b. How did Facebook’s opening do compared to these other IPO's? c. What do these other IPO's tell me about how Facebook might do in the near future? Source: http://www.nasdaq.com/symbol/fb/historical http://www.nasdaq.com/symbol/nflx/interactive-chart Brought to you by Yummymath.com


