The Impact of Large Time Deposits on the Growth Rate
advertisement

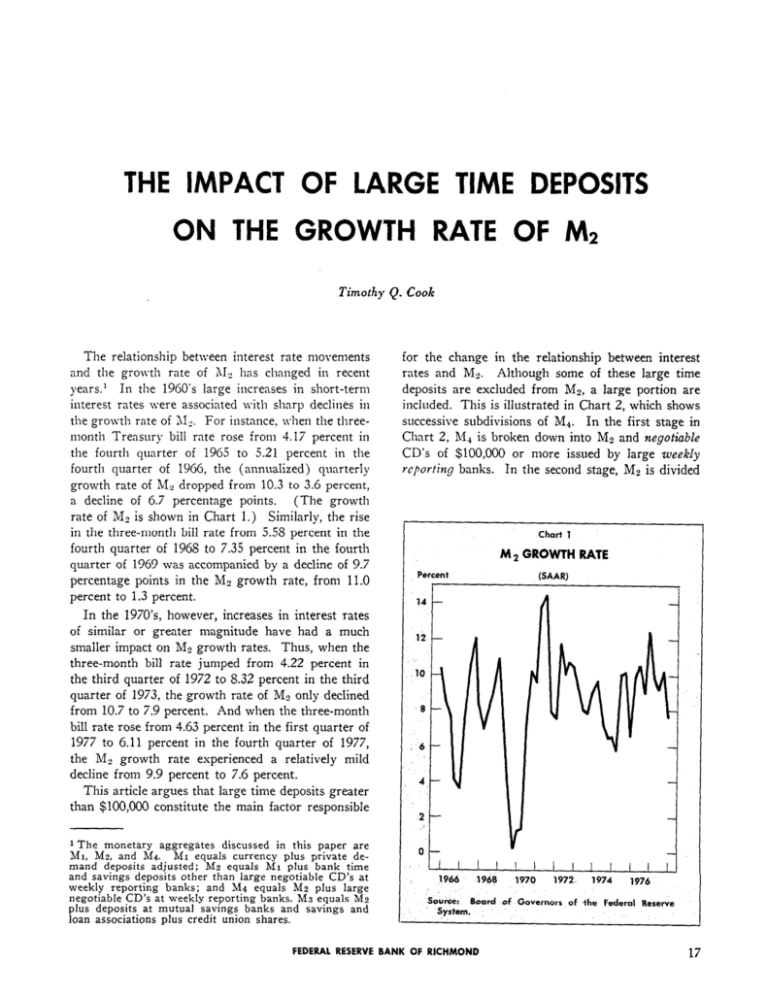
THE IMPACT OF LARGE TIME DEPOSITS ON THE GROWTH RATE OF M1 Timothy Q. Cook The relationship between interest rate movements and the grolvth rate of 31, has changed in recent years.’ In the 1960’s large increases in short-term interest rates \yere associated with sharp declines in the growth rate of LIZ. For instance, nhen the threemonth Treasury bill rate rose from 4.17 percent in the fourth quarter of 196.5 to 5.21 percent in the fourth quarter of 1966, the (annualized) quarterly growth rate of Me dropped from 10.3 to 3.6 percent, a decline of 6.7 percentage points. (The growth rate of Mz is shown in Chart 1.) Similarly, the rise in the three-month bill rate from 5.55 percent in the fourth quarter of 1965 to 7.35 percent in the fourth quarter of 1969 was accompanied by a decline of 9.7 percentage points in the MZ growth rate, from 11.0 percent to 1.3 percent. In the 1970’s, however, increases in interest rates of similar or greater magnitude have had a much smaller impact on M-3 growth rates. Thus, when the three-month bill rate jumped from 4.22 percent in the third quarter of 1972 to 8.32 percent in the third quarter of 1973, the growth rate of M2 only declined from 10.7 to 7.9 percent. And when the three-month bill rate rose from 4.63 percent in the first quarter of 1977 to 6.11 percent in the fourth quarter of 1977, the M, growth rate experienced a relatively mild decline from 9.9 percent to 7.6 percent. This article argues that large time deposits greater than $100,000 constitute the main factor responsible 1 The monetary aggregates discussed in this paper are Mt, M2, and M4. MI equals currency plus private demand deposits adjusted; M2 equals MI plus bank time and savings deposits other than large negotiable CD’s at weekly reporting banks; and M4 equals M2 plus large negotiable CD’s at weekly reporting banks. M3 equals M2 plus deposits at mutual savings banks and savings and loan associations plus credit union shares. for the change in the relationship between interest rates and Ms. Although some of these large time deposits are excluded from MZ, a large portion are included. This is illustrated in Chart 2, which shows successive subdivisions of Md. In the first stage in Chart 2, R/I1 is broken down into M2 and negotiable CD’s of $100,000 or more issued by large weekly reporting banks. In the second stage, MP is divided Chart 1 M 2 GROWTH Percent 14 RATE LSAAR) ri- ,8 ” 6 \ 4 2 I 0 L 1 I 1966 I I 1968 I I 1970 I I 1972. I I 1974 I I IJ 1976 Source: Board of Governors of ‘the Federal Reserve System. FEDERAL RESERVE BANK OF RICHMOND 17 Chart 2 ~OSl?~O~ OF LARGE TlME DEPQSITS IN THE MONETARY AGGREGATES Small Other rwingr into Ml and other time and savings deposits. Other time and savings deposits are in turn divided into savings cleposits and other tillie deposits. As shown in stqe four of the chart. other time deposits include (I> stl2all time deposits less th:m ~100.000 and (2j those large tii22e deposits greater thr?n $100,000 that are included in 11,. The Intter category k composed of negotiable and nonnegotiable tiiile deposits greater than $100,000 at nonweekly reporting banks and nonnegotiable time deposits greater than S100.000 at weekly reporting banks. time and Other deposits time time depaoritr deposits with maturities less than 90 days. Since then, the gron-th rates oi both categories of large time deposits have been ~ositkcl~ correlated \Yith interest rate For example. large increases in both cateIesels. wries nccompnnied the rise ir? interest rates in 1’377. b Most analyses of the behnYior of II:! go no further than stage two. \\‘hen one gets to stage four. however, it becomes clear that X:! contains z2 significant amount of laige tin2e deposits greater than $100,000 szot szrbjcct fu infcrcst m fe cL7ifiag.s. (These ceiiings were suspended in June 1970 for maturities less than 90 days and in May 1973 for all otl2er maturities.) In fact, as of October 1977, $SO.S billion or 55 percent of total large time deposits were included in Mg. The positive relationsl2ip between market interesr rates and the growth of inrge time deposits stems p:!rtially from rhe response of commercial banks to chnnges in rhe flo~ss of small time and savings deposits induced by interest rnte movements. t\‘hen ititerest rates rise relative to the rates paid on saskgs deposits and small time deposits (\silich are constrained bx Regulation Q ceilings j. inflows of funds into these tlepo4ts contrxt. Ennks try to offset &ese reduced inllon-s 1.1~I)iddin,g more aggressivel>. for Inrge time deposits. IShiCli are not subject to interest rate ceilings. Con\-erseI>-, n-hen inflows of sai-ings deposits and smaI1 time deposits espand, banks are contei2t to le: infio\\-s of large time deposits decline.’ Chari 4 illustrates this bekwior by comparing ,quarterly changes in the sum of savings and small time Chart 3 shows that large time deposits escluded from I& behave very similarly over time to those included in 312. Both fell rapidly in 1969 as market interest rates rose above Regulation Q ceilings for large time deposits of $100,000 or greater. Similarly, both increased sharply following the removal in June 1970 of Regulation Q ceilings on large time deposits 2 Oi course:. this bcizal-ior is to some estent conditioned by :!x state or’ 10x1 den~a:ld. Banks issue lar.ge time deposits not Oll!~ to offset deciines i:l inflo~vs or small rime increzses iC and savings deposits. but also to iinance commcrci2i 2nd industrial !oarS. Large increzses in &ese loaxis tend to Itc associated \vi:lr PCiiOds oi rising interest Tilis is a second channel underiCng the positive rates. ihtciest rate5 2nd rela?io!~~hip noted in the test bet\vCen the gron-th rate of iargc time cicposits in The 1970’s. 18 ECONOMIC REVIEW, MARCH/APRIL 7978 deposits to quarterly changes in large time deposits included in Mz. The inverse relationship between the two series is remarkably close. In fact, the correlation coefficient between the two series from the first quarter of 1972 through the fourth quarter of 1977 is -.91. (The correlation coefficient between the growth rates over the same period is -.89.) This phenomenon was particularly evident in 1977. As the growth rate of savings plus small time deposits plummeted in response to the rise in interest rates, the impact on bank funds was ‘largely offset by a sharp rise in the growth rate of large time deposits not subject to interest rate ceilings. Chart 5 illustrates the influence of large time deposits on the growth rate of Mz in recent years. The chart compares the quarterly growth rates of Ma and MX*, the latter aggregate consisting of Mz less its large time deposit component. The two growth rates often diverge by three percentage points or more. For example, the Ma growth rates in the second and third quarters of 1973 were 8.1 and 7.9 percent, respectively, while the corresponding M2* growth rates were only 2.8 and 2.7 percent. Furthermore, large time deposits have greatly lnoderated the cyclical swings of iU2 since 1971. For instance, from the second quarter to the third quarter of 1977 the growth rate of M 2* fell from 10.9 to 7.9 percent, while the growth rate of Mz actually rose from 9.2 to 10.3 percent. In the fourth quarter of 1977 the growth rate of NZ * fell further to 4.8 percent, but ).. “.‘,:2O.,_.. j : :a, ::i a;: !, 1: ;;“ .,:.<16 ,. _.. .‘.(” “, p,:J?. ~.--!A FEDERAL RESERVE BANK OF RICHMOND M, Growth Rate -1 , 1 AI A i 19 the surge of large time deposits growth rate of M.12at 7.6 percent. maintained the Prior to the June 1970 change in Regulation Q, large time deposits did not moderate cyclical swings in M3, because as interest rates rose above Regulation Q ceilings on deposits greater than $100,0001 the growth rate of large time deposits would fall below that of the rest of 112. In fact, in the period of rapidly rising interest rates from the fourth quarter 1968 to the fourth quarter oi 1969 the growth rate of 39, dropped by 2.9 percentage points NLOYEthan the growth rate of Mp* because of the rapid run-oii of large time deposits. Consequently, the 1970 change in Regulation Q emerges as the major factor underlying the change in the relationship between the movements of interest rates and the growth rate of ~MZin the 1970’s as compared with the latter half of the 1960’s. CONCLUSION This article has demonstrated that movements in Iarge time deposits significantly affect the quarterly growth rate of Mz, frequently increasing or decreasing it by three or more percentage points. Furthermore, since the 1970 change in ReguIation Q, large time deposits have substantially moderated cyclical movements in Ms. At least three conclusions can be drawn from these observations. First, large time deposits excluded from 312 and those included in iiq2 are very similar in their characteristics and in the regulations that apply to them. Therefore, it makes little sense to include one component of large time deposits in &Is or any other monetary aggregate while es&ding the other component. Large time deposits should either be excluded altogether, as in Mz*:, or fully included, as in MC. 20 ECONOMIC REVIEW, Second, failure to distinguish between MC and ht* could create policy problems. Since the 1970 change in Regulation Q, the response of X2* to a change in interest rates has been greater than the corresponding Mz response. Consequently, if the monetary authorities are focusing on HZ, the response of AI,* to a policy change might Iead to a greater impact on the economy than desired.3 A second policy problem might occur if the monetary authorities are using past (i.e., 1960’s] data to forecast the reIationship betn.een 112 and economic activity. Given the significant change in the behavior of 312 in the 1970’s, it seems cj~~ite likely that this relationship has changed. I-or instance, the decline in the growth rate of M- preceding the very deep recession in 1974 was relatively small in comparison to the sharp drop in the & growth rate preceding the much milder recession beginning in 1969. (See Chart 1.) Lastly, empirical studies of the behavior of bank liabilities generally aggregate large time deposits other than negotiable CD’s at weekly reporting banks with small time and savings deposits, primarily because the data are published in that form. However, given the similar behavior of negotiable CD’s at weekly reporting banks and other large time deposits on the one hand, and the disparate behavior of other large time deposits and small time and savings deposits on the other hand, a more appropriate procedure is to aggregate the two categories of large time deposits. e This point is made by Roger M’aud in “CD Behavior and the Use of Broader S/fonetary Aggregates” (Journal of Money, Credit and Banking, August 1977, Vol. IX, n-0. 3, 183-490) with respect to t!w differential behavior of &fx, 15s and 513, on one hand, and 114 and Xs (which include CD’s) on the other. Whether the failure to distinguish between Lfs and Mz* creates policy difficulties ultimately depends on which aggregate (if either) 1s a more appropriate intermediate target of monetary policy. MARCH/APRIL 1978


