Dow Jones U.S. Dividend 100 Index
TM
Fact Sheet
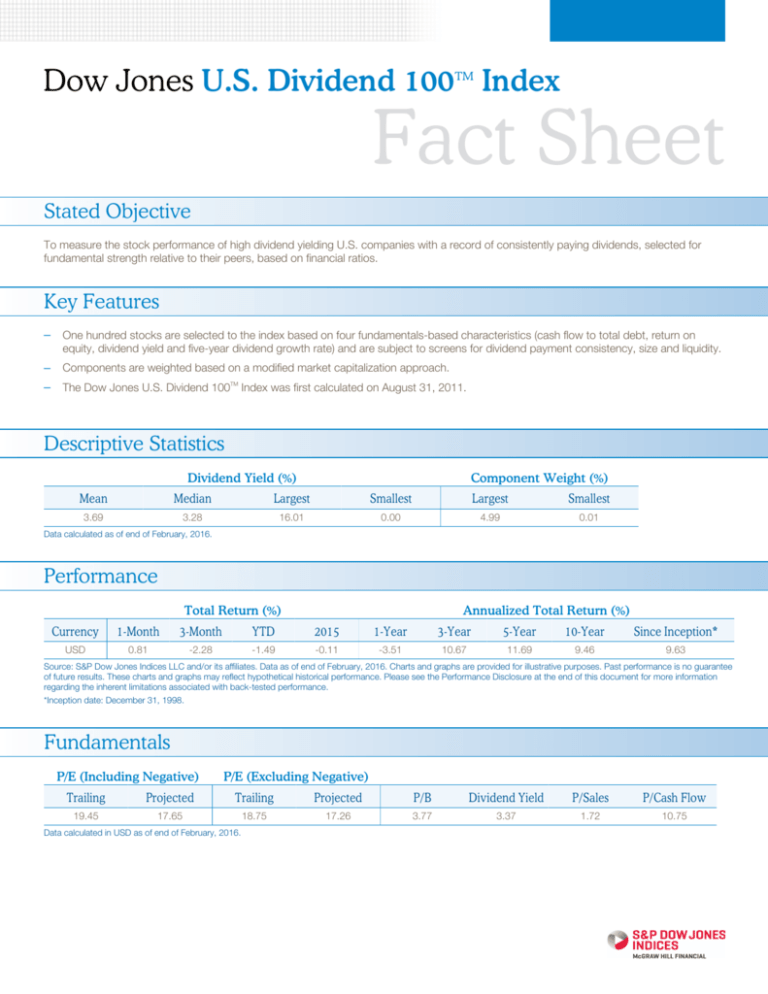
Stated Objective
To measure the stock performance of high dividend yielding U.S. companies with a record of consistently paying dividends, selected for
fundamental strength relative to their peers, based on financial ratios.
Key Features
—
One hundred stocks are selected to the index based on four fundamentals-based characteristics (cash flow to total debt, return on
equity, dividend yield and five-year dividend growth rate) and are subject to screens for dividend payment consistency, size and liquidity.
—
Components are weighted based on a modified market capitalization approach.
—
The Dow Jones U.S. Dividend 100TM Index was first calculated on August 31, 2011.
Descriptive Statistics
Dividend Yield (%)
Component Weight (%)
Mean
Median
Largest
Smallest
Largest
Smallest
3.69
3.28
16.01
0.00
4.99
0.01
Data calculated as of end of February, 2016.
Performance
Total Return (%)
Annualized Total Return (%)
Currency
1-Month
3-Month
YTD
2015
1-Year
3-Year
5-Year
10-Year
Since Inception*
USD
0.81
-2.28
-1.49
-0.11
-3.51
10.67
11.69
9.46
9.63
Source: S&P Dow Jones Indices LLC and/or its affiliates. Data as of end of February, 2016. Charts and graphs are provided for illustrative purposes. Past performance is no guarantee
of future results. These charts and graphs may reflect hypothetical historical performance. Please see the Performance Disclosure at the end of this document for more information
regarding the inherent limitations associated with back-tested performance.
*Inception date: December 31, 1998.
Fundamentals
P/E (Including Negative)
P/E (Excluding Negative)
Trailing
Projected
Trailing
Projected
P/B
Dividend Yield
P/Sales
P/Cash Flow
19.45
17.65
18.75
17.26
3.77
3.37
1.72
10.75
Data calculated in USD as of end of February, 2016.
Dow Jones U.S. Dividend 100TM Index
Fact Sheet
Symbols
Total Return
USD
Price Return
USD
Suggested Symbol
DJUSDIVT
DJUSDIV
Bloomberg
DJUSDIVT
DJUSDIV
Bridge
US&DJUSDIV.T
US&DJUSDIV
Reuters
.DJUSDIVT
.DJUSDIV
Thomson
.DEIVT
.DEDIV
Telekurs
DJUSDIVT
DJUSDIV
Sector Allocation
Consumer Goods
21.95%
Industrials
17.23%
Technology
15.75%
Consumer Services
12.27%
Health Care
11.42%
Oil & Gas
11.09%
Telecommunications
4.99%
Basic Materials
2.75%
Financials
1.82%
Utilities
0.72%
Data calculated in USD as of end of February, 2016.
Sectors are based on the ten industries defined by the proprietary
classification system as described at www.djindexes.com
Top Components
Company
Country
ISIN/Ticker
Industry
Supersector
Adjusted Weight (%)
Verizon Communications Inc
United States
VZ
Telecommunications
Telecommunications
4.99%
Exxon Mobil Corp
United States
XOM
Oil & Gas
Oil & Gas
4.86%
Procter & Gamble
United States
PG
Consumer Goods
Personal &
Household Goods
4.74%
Johnson & Johnson
United States
JNJ
Health Care
Health Care
4.73%
Microsoft Corp
United States
MSFT
Technology
Technology
4.25%
Pfizer Inc
United States
PFE
Health Care
Health Care
4.22%
Coca-Cola Co
United States
KO
Consumer Goods
Food & Beverage
4.09%
Home Depot Inc
United States
HD
Consumer Services
Retail
3.86%
Chevron Corp
United States
CVX
Oil & Gas
Oil & Gas
3.80%
PepsiCo Inc
United States
PEP
Consumer Goods
Food & Beverage
3.48%
Copyright © 2016 by S&P Dow Jones Indices LLC, a subsidiary of The McGraw-Hill Companies, Inc., and/or its affiliates.
Dow Jones U.S. Dividend 100TM Index
Fact Sheet
Quick Facts
Component Number
100
Weighting
Modified market capitalization approach
Review Frequency
Annually, in March
Base Value/Base Date
1000 as of December 31, 1998
Calculation Frequency
Every 15 seconds during U.S. stock exchange trading hours
Dividend Treatment
Price return and total return versions are available. The total return version of the index is calculated with gross
dividends reinvested.
Estimated Back-Tested
History Availability
Available daily back to December 31, 1998
Launch Date
August 31, 2011
For more information on the Dow Jones U.S. Dividend 100TM Index,
email index_services@spdji.com
or call Americas +1.212.438.2046 | Asia +86.10.6569.2770 | EMEA : +44.20.7176.8888
Learn more at www.djindexes.com.
Dow Jones U.S. Dividend 100TM Index
Fact Sheet
All information as of end of February, 2016
Source: S&P Dow Jones Indices LLC.
The launch date of the Dow Jones U.S. Dividend 100TM Index was August 31, 2011.
All information presented prior to the index launch date is back-tested. Back-tested performance is not actual performance, but is hypothetical. The back-test calculations are
based on the same methodology that was in effect when the index was officially launched. Past performance is not a guarantee of future results. Please see the Performance
Disclosure at http://www.spindices.com/regulatory-affairs-disclaimers/ for more information regarding the inherent limitations associated with back-tested performance.
© S&P Dow Jones Indices LLC, a part of McGraw Hill Financial 2016. All rights reserved. Redistribution, reproduction and/or photocopying in whole or in part are prohibited without
the written permission of S&P Dow Jones Indices. Standard & Poor’s and S&P are registered trademarks of Standard & Poor’s Financial Services LLC (“S&P”), a part of McGraw Hill
Financial, Inc. Dow Jones is a registered trademark of Dow Jones Trademark Holdings LLC (“Dow Jones”). S&P Dow Jones Indices LLC, Dow Jones, S&P and their respective
affiliates (“S&P Dow Jones Indices”) make no representation or warranty, express or implied, as to the ability of any index to accurately represent the asset class or market sector
that it purports to represent and S&P Dow Jones Indices shall have no liability for any errors, omissions, or interruptions of any index or the data included therein. Past performance
of an index is not an indication of future results. This document does not constitute an offer of any services. All information provided by S&P Dow Jones Indices is general in nature
and not tailored to the needs of any person, entity or group of persons. It is not possible to invest directly in an index. S&P Dow Jones Indices may receive compensation in
connection with licensing its indices to third parties. Exposure to an asset class represented by an index is available through investable instruments offered by third parties that are
based on that index. S&P Dow Jones Indices does not sponsor, endorse, sell, promote or manage any investment fund or other investment vehicle that seeks to provide an
investment return based on the performance of any Index. S&P Dow Jones Indices LLC is not an investment advisor, and S&P Dow Jones Indices makes no representation
regarding the advisability of investing in any such investment fund or other investment vehicle. For more information on any of our indices please visit www.spdji.com .
Ed 03-03-16, FACT-296-649-022916


