Imaging the Radio Universe - National Radio Astronomy Observatory
advertisement
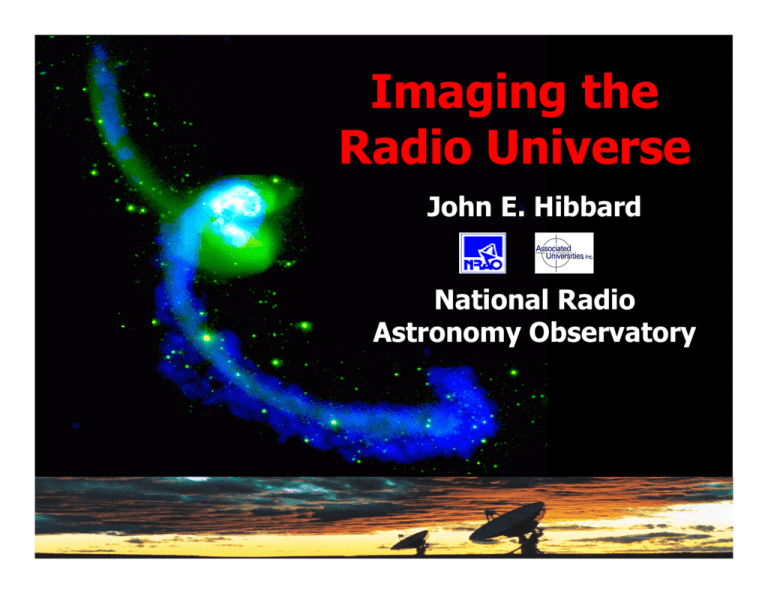
Imaging the Radio Universe John E. Hibbard National Radio Astronomy Observatory What is “seeing”? • We “see” an object when the electromagnetic radiation it emits or reflects interacts with cells in our eyes • Astronomers “see” an object when the electromagnetic radiation it emits or reflects interacts with our detectors So what is electromagnetic radiation? • A traveling, massless packet of energy which corresponds to an oscillating electric and magnetic field ¾ Also known as: radiation, or a light wave, or a photon Travels at the speed of light (by definition). Remarkably, all radiation travels at this speed, regardless of whether is carries a lot of energy or only a little Animation from Nick Strobel’s Astronomy Notes (www.astronomynotes.com) The nature of the radiation is described by its wavelength and/or frequency and/or energy Distance between peaks=wavelength, Number of peaks that past by λ λ= each second = frequency, speed of light ν Long wavelengths = short frequencies Short wavelengths = high frequencies ν The Electromagnetic Spectrum Longer waves Lower energy Lower frequency Shorter waves Higher energy Higher frequency Wavelength range: 300 meters to 0.5 mm Frequency range: 1 MHz (1 million Hertz or cycles per second) to 500 GHz (500 billion Hertz) The one idea I want you to take home with you: We do not “listen” to Radio Data Radio Waves are not Sound Waves • Radio waves are electromatic radiation, exactly like light (and x-rays, and microwaves, etc). • Sound waves are pressure waves. Require a medium (air, water, etc.) to travel through. • Sound is created by a pressure wave moving a membrane in your ear. Your brain turns the vibration of this membrane into “sound”. Ear Medium Sound You do not listen to radio waves with a radio Sound wave 5 Hz – 20 kHz Microphone membrane Electronically encoded sound wave (5 Hz – 20 kHz) Radio wave At broadcast frequency (e.g., 1100 kHz) Electronically Modulated Modulated signal = Radio signal modulated by electronically encoded sound Your radio, tuned to the appropriate frequency: demodulates broadcast frequency; electronically encoded sound wave drives speaker cone Radio broadcast tower Radio Telescopes • Come in two basic flavors: Green Bank Telescope, WV Single Dish Very Large Array, NM Arrays Robert C. Byrd Green Bank Telescope • 2000 dedication • Operated from West Virginia • 100 x 110m, novel offset design • Just coming into full operation The Very Large Array (VLA) • 1980 dedication • Twenty-seven 25-m antennas in reconfigurable array outside of Socorro, NM • Has produced more published science than any other telescope on the face of the Earth Very Long Baseline Array (VLBA) • 1993 dedication • Operated from Socorro • Ten 25-m antennas spread across US, Canada, P.R. • Highest resolution imager in astronomy Other Millimeter & Centimeter Wave Radio Telescopes Arecibo, P.R. Owens Valley Radio Observatory, CA Berkeley-Illinois-Maryland Array, CA Radio Telescopes: Resolution • Resolving power (how small of a thing you can “see”) depends on the size of the telescope and the wavelength of the light For radio waves, λ size this is large… So this must also be large • “Size” = diameter of telescope for single dish; maximum distance between telescopes for arrays Radio Telescopes: Resolution Green Bank Telescope, WV Very Large Array, NM Size Size Single Dish Arrays Reconfigurable Arrays: Zoom Lens Effect VLA VLBA • Larger arrays give you better and better resolution • Trade-off with sensitivity (collecting area stays the same while diameter increases) Radio Telescopes: Sensitivity • Sensitivity (how faint of a thing you can “see”) depends on how much of the area of the telescope/array is actually collecting data ¾ VLA B-array: Total telescope collecting area is only 0.02% of land area • More spread-out arrays can only image very bright, compact sources Basic Elements of a Radio Antenna VLBA Antenna: • 25 meters (82 feet) in diameter • As tall as a 10story building • Weighs 240 tons Parabolic Dish Green Bank Telescope, WV • Aluminum reflecting surface • Focuses incoming waves to prime focus or subreflector Sub-reflector Sub-reflector Subreflector • Re-directs incoming waves to Feed Pedestal • Can be rotated to redirect radiation to a number of different receivers Feed Pedestal Feed Pedestal 1.5GHz 2.3GHz 4.8GHz 8.4GHz 14GHz 23GHz 43GHz 86GHz 327MHz 610MHz 20cm 13cm 6cm 4cm 2cm 1.3cm 7mm 3mm 90cm 50cm Antenna Feed and Receivers Benefits of Observing in the Radio • Track physical processes with no signature at • • • • other wavelengths Radio waves can travel through dusty regions Can provide information on magnetic field strength and orientation Can provide information on line-of-sight velocities Daytime observing (for cm-scale wavelengths anyway) Primary Astrophysical Processes Emitting Radio Radiation When charged particles change direction, they emit radiation • Synchrotron Radiation ¾ Charged particles moving along magnetic field lines • Thermal emission ¾ ¾ Cool bodies Charged particles in a plasma moving around • Spectral Line emission ¾ Discrete transitions in atoms and molecules Synchrotron Radiation • Polarization properties of light provides information on magnetic field geometry Thermal Emission • Emission from warm bodies ¾ ¾ “Blackbody” radiation Bodies with temperatures of ~ 3-30 K emit in the mm & submm bands • Emission from accelerating charged particles ¾ “Bremsstrahlung” or freefree emission from ionized plasmas Spectral Line emission: hyperfine transition of neutral Hydrogen Emits photon with a wavelength of 21 cm (frequency of 1.42 GHz) Transition probability=3x10-15 s-1 = once in 11 Myr Spectral Line emission: molecular rotational and vibrational modes • Commonly observed molecules in space: Carbon Monoxide (CO) ¾ Water (H2O), OH, HCN, HCO+, CS ¾ Ammonia (NH3), Formaldehyde (H2CO) ¾ • Less common molecules: ¾ Sugar, Alcohol, Antifreeze (Ethylene Glycol), … malondialdyde Spectral Line Doppler effect • Spectral lines have fixed and very well determined frequencies • The frequency of a source will changed when it moves towards or away from you Sees longer wavelength Sees shorter wavelength • Comparing observed frequency to known frequency tells you the velocity of the source towards or away from you Sees original wavelength Special example of Spectral Line observation: Doppler Radar Imaging …bounce off object… Transmit radio wave with well defined frequency… ..observe same frequency NASA’s Goldstone Solar System Radar Very Large Array Brief Tour of the Radio Universe • Solar System ¾ Sun, Planets, Asteroids • Galactic objects ¾ Dark clouds, proto-stellar disks, supernova remnants, • Galaxies ¾ Magnetic fields, neutral hydrogen • Radio Jets • The Universe Our Star, The Sun • Radio Sun • Coronal Mass Ejections (CMEs) • “Space weather” • Structure of Solar Wind Courtesy Steven White (UMd) Thermal free-free emission from chromosphere and active regions. Dark filaments=dense cool material suspended in the corona Solar Magnetic Field Strength and Structure Active region showing strong shear: radio images show high B and very high temperatures from Lee et al (1998) from J. Lee Solar Flares Type U bursts observed by Phoenix/ETH and the VLA. Aschwanden et al. 1992 Coronal Mass Ejections (CMEs) • Largest explosions on the Sun • Large portion of the Solar Corona destabilizes and is ejected at speeds of 2002000 km/s • Accelerate charged particles to close to the speed of light • Major drivers of “space weather” effects ¾ Optical light SOHO/LASCO Can take down power grids, induce currents in oil pipelines, disrupt navigaton cdaw.gsfc.nasa.gov/CME_list/ Noise storm Synchrotron Radiation from MeV electrons. B~1 Gauss Bastian et al. (2001) Particles accelerated during Solar Flares and CMEs can seriously impact interplanetary travel Fatal Dose Venus • Optical/UV view of Venus from Pioneer 10 ¾ Clouds, clouds, and more clouds • 13 cm Radar image of Venus using Arecibo and GBT ¾ ¾ Bright=rougher surface Dark=smoother surface Campbell, Margot, Carter & Campbell Jupiter Jupiter - Synchrotron Charged particles trapped in Jupiters magnetic field Similar to earths Van Allen belt At times, Jupiter outshines the Sun at radio wavelengths – can use this fact for finding extrasolar analogs Observations: VLA 20 cm De Pater, Schulz & Brecht 1997 3-D model: Sault et al. 1997; de Pater & Sault 1998 www.atnf.csiro.au/people/rsault/jupiter/movies/ Doppler Radar Imaging of Asteroids • S-band (2380 MHz, 12.6 cm) radar imaging of main belt Asteroid 216 Kleopatra using Arecibo • 217 km by 94 km by 81 km • “dog-bone” structure may be the result of two asteroids colliding Doppler Radar Imaging of Asteroids • S-band (2380 MHz, 12.6 cm) radar imaging of main belt Asteroid 216 Kleopatra using Arecibo • 217 km by 94 km by 81 km • “dog-bone” structure may be the result of two asteroids colliding Computer reconstruction by Ostro et al. 2000, Science, 288, 836 echo.jpl.nasa.gov Formation of a Star • In early stages, before star turns on, protostar is enshrouded in gas and dust • Radio and far-infrared are the only types of radiation which can get out • Gas cloud contains many trace molecules (CO, NH3, many others) which emit at mm wavelengths Dark Star Forming Clouds L483 Molecular Cloud Near-infrared (1.2 microns) A. Wootten & G. Fuller www.nrao.edu/imagegallery NRAO 12-m CO(1-0) Gas glows most brightly where accretion onto a protostar warms the cloud Proto-stellar Outflows Blue-shifted gas “9 point” radio map of bipolar molecular outflow from the S106 protostar Blue=Towards us Red=Away from us Red-shifted gas S106, IR Subaru Telescope, Japan G192.16-3.82 – Inner Accretion Disk VLA + VLBA 43 GHz (7mm) observations of ionized gas and warm dust from inner-most region surrounding massive protostar (Shepherd et al. 2001). Contours: observations Color: model of accretion disk, central star, outflow, & companion protostar: 8 Msun protostar 3-20 Msun disk Credit: B. Starosta, NRAO/AUI/NSF Outflow with 40° opening angle. Cassiopeia A Supernova Remnant • Remnant of a massive star that exploded ~300 years ago • VLA image at 1.4, 5, and 8.4 GHz • Synchrotron emission from tangled magnetic fields Rudnick et al., Image by T. Rector www.nrao.edu/imagegallery The Crab Nebula • Remnant of a supernovae from 1054 AD • Expanding at 1000 km/sec • Central star left behind a rapidly spinning pulsar • Wind from pulsar energizes the nebula, causing it to emit in the radio M. Bietenholz www.nrao.edu/imagegallery Center of our Galaxy VLA 20cm VLA 1.3cm VLA 3.6cm Credits: Lang, Morris, Roberts, Yusef-Zadef, Goss, Zhao Same Space -- Different Light Radio Infrared Optical X-ray Extragalactic Supernovae SN 1993J in M81 Bartel, Bietenholz, Rupen et al. VLBA Observation from May 17, 1993 – Feb 25 2000 aries.phys.yorku.ca/~bartel/SNmovie.html Magnetic Field Orientation in Galaxies NOAO Optical+Hα image Radio Continuum Beck, Horellou, Neininger www.noao.edu Lines=Magnetic Field Orientation www.nrao.edu/imagegallery Neutral Hydrogen in Galaxies • B/W=optical image of NGC 6946 from Digital Sky Survey • Blue=Westerbork Synthesis Radio Telescope 21 cm image of Neutral Hydrogen • Neutral Hydrogen is the raw fuel for all star formation • Hydrogen usually much more extended than stars 21 cm Spectral Line Observations Often find things you’d never guess from optical light 570,000 light years Optical Image of Ring Galaxy Arp 143 VLA 21cm observation Appleton et al. 1987 21 cm Spectral Line Observations Often find things you’d never guess from optical light Optical image of M81 Group (DSS) VLA 12-pointing mosaic Yun et al. 1994 Spectral Line Observations also provide velocity information This tail is moving away from us This tail is moving towards us Spatial and Velocity information help motivate physical models N-body simulation of NGC 4676 “The Mice” Hibbard & Barnes, in preparation N-body simulation of NGC 4676 “The Mice” Hibbard & Barnes, in preparation N-body simulations provide past/future evolution and 3-D geometry Information from Radio compliments that from other wavelengths X-ray: Karovska et al. Optical: DSS Radio Continuum: NVSS 21cm: Schiminovich et al. Chandra.harvard.edu Radio Jets 200 kpc 650,000 light years Optical quasar An exclusively radio phenomena Jet Mechanism: • Accretion of gas onto a massive central black hole releases tremendous amounts of energy • Magnetic field collimates outflow and accelerates particles to close to the speed of light VLBA TimeElapsed Observations of the Innermost Regions of a Jet AGN Artistic Simulation by Steffen & Gomez 3C 353 3C 175 3C 433 NGC 326: “Smoking Gun” of Colliding Black Holes • Inset HST optical image shows two nuclei, presumably the result of two galaxies merging • “X-shaped radio jets show radi axis has flipped • It is thought that only another black hole can realign a black hole jet Merritt & Ekers www.nrao.edu/imagegallery Wilkinson Microwave Anisotropy Probe (WMAP) map.gsfc.nasa.gov K-band Ka-band Q-band V-band 23 W-band 61 41 33 94GHz GHz GHz GHz Background=3 K blackbody radiation Shepherding in the era of “Precision Cosmology” So What’s Next for Radio Astronomy? • 2003-2013: ¾ EVLA: making the VLA ten times better ¾ ALMA: VLA for the sub-millimeter ¾ ATA: SETI lives on • 2008-2030+ ¾ FASR: solar array ¾ LOFAR: low frequency array ¾ SKA: collecting area of 75 VLA’s Atacama Large Millimeter Array A project of the National Science Foundation and the National Research Foundation of Canada through the North American Project for Radio Astronomy via its partners, Associated Universities, Inc. operating the National Radio Astronomy Observatory, and the Herzberg Institute of Astronomy and the European Southern Observatory and its partners The Centre National de la Recherche Scientifique (CNRS), France; Max Planck Gesellschaft (MPG), Germany; The Netherlands Foundation for Research in Astronomy, (NFRA); Nederlandse Onderzoekschool Voor Astronomie, (NOVA); The United Kingdom Particle Physics and Astronomy Research Council, (PPARC);The Swedish Natural Science Research Council, (NFR); and the Ministry de Ciencia y Tecnologia and Instituto Geografico Nacional (IGN,)(Spain) EuB • • • ALMA will be an array of 64 precision engineered antennas deployed in the Atacama desert in the high Andes in Chile. Configurable array, like the VLA, to provide a zoom-lens capability. Most of the energy in the Universe lies at submillimeter/millimeter wavelengths yet we cannot image the sources of this energy with reasonable detail. ALMA will reach the sensitivity of current submm telescopes in seconds, with resolutions reaching 10mas. ALMA has been endorsed as the highest priority project for the next decade by the astronomical communities of the United States, Canada, the United Kingdom, France, the Netherlands and Japan (the latter as LMSA). Planned completion in 2012. Al Wootten, ALMA/US Project Scientist The Allen Telescope Array • First telescope designed specifically for the Search for Extra-Terrestrial Intelligence (SETI) • Array of 350 commercial satellite dishes, 6m in diameter. More collecting area than the GBT • Will speed SETI targeted searching by 100x Will target from 100,000 to 1 million nearby stars ¾ Will scan 100 million radio channels ¾ • Start-up scheduled for 2005 www.seti-inst.edu/seti/our_projects Proposed Radio Instruments: 2008: Low-Frequency Array (LOFAR) A low-frequency (10-240 MHz) multi-beamforming array composed of ~100 antenna “stations” each containing ~100 individual antenna, spread over an area of ~400 km. Will open a new window on the Universe www.lofar.org 2009: Frequency Agile Solar Radiotelescope (FASR) A multi-frequency (~0.1 - 30 GHz) imaging array composed of ~100 antennas for imaging the Sun with high spectral, spatial, and temporal resolution. www.ovsa.njit.edu/fasr/ 2030?: Square Kilometer Array (SKA) A multi-frequency (~0.1 - 3 GHz?) imaging array with a collecting area of 1 square kilometer. www.skatelescope.org Conclusions • Radio astronomical imaging is a relatively young, but rapidly advancing field which will explode in the next decade • You don’t have to have a well-funded P.R. machine to churn out fascinating science
