Lab 11 Chemical Equilibrium Constant
advertisement
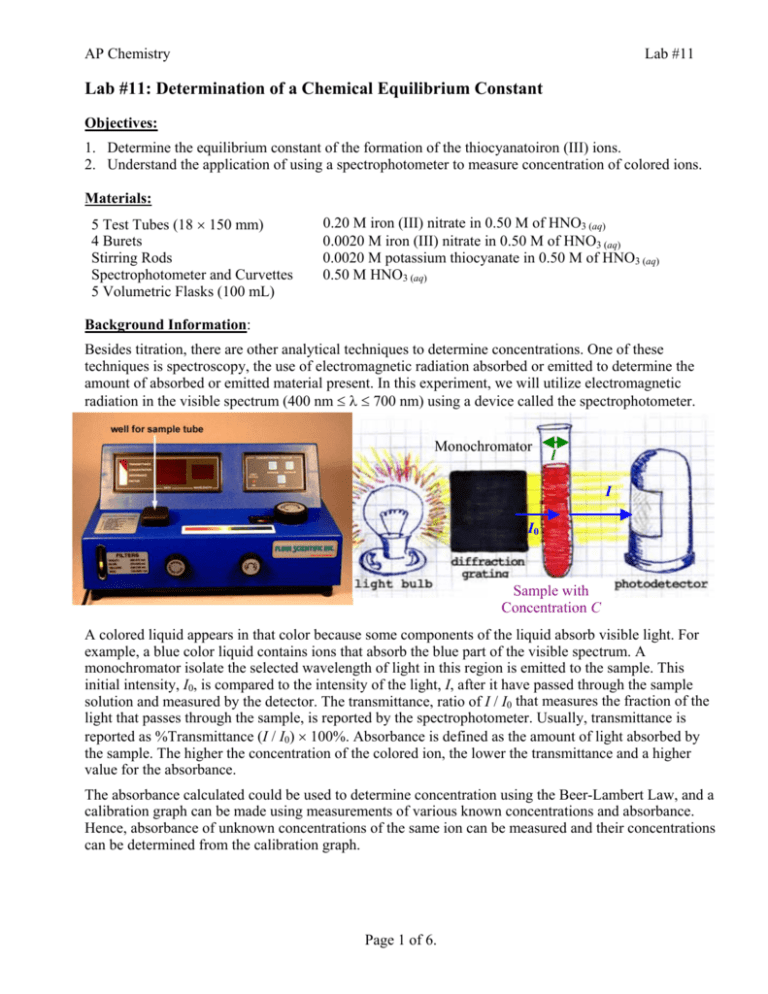
AP Chemistry Lab #11 Lab #11: Determination of a Chemical Equilibrium Constant Objectives: 1. Determine the equilibrium constant of the formation of the thiocyanatoiron (III) ions. 2. Understand the application of using a spectrophotometer to measure concentration of colored ions. Materials: 5 Test Tubes (18 × 150 mm) 4 Burets Stirring Rods Spectrophotometer and Curvettes 5 Volumetric Flasks (100 mL) 0.20 M iron (III) nitrate in 0.50 M of HNO3 (aq) 0.0020 M iron (III) nitrate in 0.50 M of HNO3 (aq) 0.0020 M potassium thiocyanate in 0.50 M of HNO3 (aq) 0.50 M HNO3 (aq) Background Information: Besides titration, there are other analytical techniques to determine concentrations. One of these techniques is spectroscopy, the use of electromagnetic radiation absorbed or emitted to determine the amount of absorbed or emitted material present. In this experiment, we will utilize electromagnetic radiation in the visible spectrum (400 nm ≤ λ ≤ 700 nm) using a device called the spectrophotometer. Monochromator l I I0 Sample with Concentration C A colored liquid appears in that color because some components of the liquid absorb visible light. For example, a blue color liquid contains ions that absorb the blue part of the visible spectrum. A monochromator isolate the selected wavelength of light in this region is emitted to the sample. This initial intensity, I0, is compared to the intensity of the light, I, after it have passed through the sample solution and measured by the detector. The transmittance, ratio of I / I0 that measures the fraction of the light that passes through the sample, is reported by the spectrophotometer. Usually, transmittance is reported as %Transmittance (I / I0) × 100%. Absorbance is defined as the amount of light absorbed by the sample. The higher the concentration of the colored ion, the lower the transmittance and a higher value for the absorbance. The absorbance calculated could be used to determine concentration using the Beer-Lambert Law, and a calibration graph can be made using measurements of various known concentrations and absorbance. Hence, absorbance of unknown concentrations of the same ion can be measured and their concentrations can be determined from the calibration graph. Page 1 of 6. AP Chemistry Lab #11 T =Transmittance I I T = T % = × 100% I0 I0 A = Absorbance I A = −log T = −log I0 or T% A = −log 100% Beer-Lambert Law A = ∈lC ∈ = molar absorptivity (molar extinction factor) in L/(mol • cm) l = length of the tube where light traveled through the sample (cm) C = Molar Concentration of the Solution There are many reactions that take place in solution that are equilibrium reactions; that is, they do not go to completion, and both reactants and products are always present. Examples of this type of reaction include weak acids such as acetic acid dissociating in water (CH3COOH (aq) + H2O (l) ⇌ H3O+(aq) + CH3COO−(aq)), weak bases such as ammonia reacting with water (NH3 (aq) + H2O (l) ⇌ NH4+(aq) + OH−(aq)), and the formation of “complex ions” in which a metal ion combines with one or more negative ions. We will study a reaction involving the formation of a complex ion, which occurs when solutions of iron (III) are combined with the negative thiocyanate ion. The equation for the reaction is as follows: Fe3+(aq) + HSCN (aq) ⇌ FeSCN2+(aq) + H+(aq) (deep red) The product, FeSCN2+, is a complex ion in which Fe3+ ions are combined with SCN− ions to form thiocyanatoiron (III) ions. It is possible to follow this reaction and calculate the equilibrium constant because the complex ion has a deep wine-red color in solution, and therefore its concentration can be determined using a spectrophotometer. The specific visible wavelength for the adjustment of the monochromator was previously found by scanning the transmittance or absorbance level of a 0.1 mol/L of FeSCN2+ over the entire spectrum. The wavelength where the minimum % transmittance or maximum absorbance is 445 nm and it is used in this experiment Maximum A at 445 nm Minimum %T at 445 nm Absorbance % Transmittance Transmittance and Absorbance of 0.1 M of FeSCN2+ in the Visible Range Wavelength (nm) Wavelength (nm) The experiment involves two major parts. First, a series of solutions of FeSCN2+ must be prepared in which the concentration of FeSCN2+ ions is unknown. A spectrophotometer is used to measure the absorbance of light of each of these standard solutions, and then a graph of concentration of FeSCN2+ vs. absorbance is prepared. This graph serves as a calibration curve, which will be used to determine the concentration of the complex ion in solutions of unknown concentration. Page 2 of 6. AP Chemistry Lab #11 Secondly, a series of solutions is prepared in which varying amounts of Fe3+ ion and HSCN are present. The absorbance of each solution is measured in the spectrophotometer, and the concentration of each substance present is determined. These values are used to determine the equilibrium concentrations and equilibrium constant for the reaction. We will use several different initial concentrations of the reactants to determine whether the equilibrium constant has the same numerical value when the complex is formed under different conditions. In order to know the relation between the absorbance of a solution and its concentration, it is necessary to prepare a calibration graph of the molar concentration of FeSCN2+ vs. Absorbance. The problem associated with this is that since the reaction is an equilibrium reaction, it does not go to completion, and the concentration of FeSCN2+ in solution is difficult to determine. We will “force” the reaction to go almost by completion by adding a large excess (over 200 times that needed) of Fe3+ ions to a small quantity of HSCN. According to Le Châtelier’s principle, this should cause the reaction to go essentially to completion. In these solutions, we can assume that all HSCN present has reacted to form FeSCN2+, so the FeSCN2+ concentration can be calculated. An additional problem of the solution is that the complex ion FeSCN2+ slowly decomposes in nitric acid solution. We can remedy this problem by preparing the solutions for this experiment within an hour from when their measurement of their absorbance values being taken. The test solutions will be prepared using a mixture KSCN, Fe(NO3)3, and HNO3 solutions. KSCN ionizes into K+ and SCN−, and in the presence of the H+ ion supplied by nitric acid, the H+ and SCN− will combine to form the weak acid HSCN. Since there is a large excess of nitric acid compared to KSCN, we can assume that all of the SCN− will be in the form of HSCN. Procedure: Part 1: Calibrating Spectrophotometer. 1. Using a buret, measure out 2.0, 3.0, 4.0, 5.0, and 6.0 mL of 0.0020 M KSCN in 0.50 M nitric acid into 100 mL volumetric flasks. 2. Add enough 0.20 M iron (III) nitrate in 0.50 M nitric acid to make 100 mL of solution. 3. Calculate the molar concentration of FeSCN2+ in each solution. 4. Set up and Use of the spectrophotometer. a. Turn the instrument on and allow it to warm up for 15 minutes. b. Set the wavelength at 445 nm. With no light passing through the instrument to the phototube, set the percent transmittance to zero with the “zero” control. c. Handle cuvettes at the top so no fingerprints are in the light path. Polish cuvettes with a tissue. Polish cuvettes with a tissue. d. Place a cuvette which is about 2/3 full of distilled water into the sample holder and set the percent transmittance to 100% with the appropriate control (not the zero control). e. Fill a cuvette about 2/3 full of a test solution, place it in the spectrophotometer and read the absorbance. f. If absorbance is difficult to measure precisely on the meter because it is in the high range where the numbers are close together, measure percent transmittance and calculate the absorbance for each solution. Absorbance = −log T, where T is the transmittance expressed as a decimal. Page 3 of 6. AP Chemistry Lab #11 Part 2: Determining K using Test Solutions 1. Obtain 5 test tubes (18 × 150 mm in size) and label the test-tubes from 1 to 5. 2. To each test tube, add 5.0 mL of 0.0020 M of Fe(NO3)3 in 0.50 M HNO3 3. Add 1.0 mL, 2.0 mL, 3.0 mL, 4.0 mL and 5.0 mL of 0.0020 M of KSCN in 0.50 M HNO3 to test tubes #1 to 5 respectively. 4. Add 4.0 mL, 3.0 mL, 2.0 mL, and 1.0 mL of 0.50 M HNO3 to test tubes #1 to 4 respectively. 5. Mix the solution well with a stirring rod. 6. Make sure the spectrophotometer is warmed up and ready. Be sure the light wavelength is set to 445 nm. Measure the absorbance (or transmittance) in the same manner that was done when calibrating the spectrophotometer. Observations: Part 1: Calibrating Spectrophotometer. Standard Volume of 0.0020 M KSCN in 0.50 M HNO3 diluted Solutions to 100 mL with 0.20 M Fe(NO3)3 in 0.50 M HNO3 1 2.0 mL 2 3.0 mL 3 4.0 mL 4 5.0 mL 5 6.0 mL % Transmittance Part 2: Determining K using Test Solutions Test Solutions 1 2 3 4 5 Volume of 0.0020 M Fe(NO3)3 in 0.50 M HNO3 5.0 mL 5.0 mL 5.0 mL 5.0 mL 5.0 mL Volume of 0.0020 M KSCN in 0.50 M HNO3 1.0 mL 2.0 mL 3.0 mL 4.0 mL 5.0 mL Volume of 0.5 M HNO3 4.0 mL 3.0 mL 2.0 mL 1.0 mL 0.0 mL % Transmittance Analysis: Part 1: Calibrating Spectrophotometer. 1. Calculate the absorbance and molar concentrations for each of the standard solutions. Show all your calculations and fill out the Table 1 below. Table 1: Absorbance and [FeSCN2+] of Standard Solutions Standard Solutions 1 2 3 4 5 Volume of 0.0020 M KSCN in 0.50 M HNO3 diluted to 100 mL with 0.20 M Fe(NO3)3 in 0.50 M HNO3 2.0 mL 3.0 mL 4.0 mL 5.0 mL 6.0 mL % Transmittance Absorbance Concentration FeSCN2+ (mol/L) 2. Plot the graph with absorbance versus molar concentrations. Find the linear regression equation and report the correlation coefficient (r). Include the graph in the lab report. Page 4 of 6. AP Chemistry Lab #11 Part 2: Determining K using Test Solutions 1. Calculate the absorbance for each of the test solutions. Show all your calculations and fill out the Table 2 below. Table 2: Absorbance of Test Solutions Volume of 0.0020 M Volume of 0.0020 M Volume of % Fe(NO3)3 in 0.50 M KSCN in 0.50 M 0.5 M Transmittance HNO3 HNO3 HNO3 5.0 mL 1.0 mL 4.0 mL 5.0 mL 2.0 mL 3.0 mL 5.0 mL 3.0 mL 2.0 mL 5.0 mL 4.0 mL 1.0 mL 5.0 mL 5.0 mL 0.0 mL Test Solutions 1 2 3 4 5 Absorbance 2. Find the moles of Fe3+ and SCN− present initially in each test solution. Show your work and fill out the table 3 below. Table 3: Initial Moles of Fe3+ and SCN− in Test Solutions Test Solutions Initial Moles of Fe3+ Initial Moles of SCN− 1 2 3 4 5 3. From the absorbance for each of the test solutions above and using the linear regression equation in Part 1, determine the molar concentrations of FeSCN2+ at equilibrium. Show all your calculations and fill out the Tables 4 and 5 below. From these [FeSCN2+]eq, calculate the moles of FeSCN2+ by showing all your calculations. Place your answers in Table 4. 4. Determine the moles of Fe3+ and HSCN at equilibrium and fill in the Table 4 below. Show all your calculations. Table 4: Equilibrium Moles of Fe3+, HSCN and FeSCN2+ in Test Solutions Test Solutions 1 2 3 4 5 [FeSCN2+]eq (mol/L) Moles of FeSCN2+ at Equilibrium Moles of Fe3+ at Equilibrium Moles of HSCN at Equilibrium 5. Calculate the molar concentrations of Fe3+ and HSCN and fill in the Table 5. H+ is an excess reagent in this equilibrium compared to the other species. It is assumed to have a constant concentration 0.5 mol/L at equilibrium. Page 5 of 6. AP Chemistry Lab #11 Table 5: Equilibrium Molar Concentrations of Fe3+, SCN−, FeSCN2+ and H+ in Test Solutions Test Solutions 1 2 3 4 5 [Fe3+]eq [HSCN]eq [FeSCN2+]eq [H+]eq 0.500 mol/L 0.500 mol/L 0.500 mol/L 0.500 mol/L 0.500 mol/L 6. Write out the equilibrium expression for the system, Fe3+(aq) + HSCN (aq) ⇌ FeSCN2+(aq) + H+(aq). 7. Find the equilibrium constant of each test solution by showing all your work and fill in Table 6. Table 6: Equilibrium Constants in Test Solutions Test Solutions 1 2 3 4 5 K 8. Calculate the average K of the 5 test solutions. Evaluation: 1. Explain what the equilibrium constant meant. Was the value constant for all your experiments? Should it be constant? 2. What does the calculated value of the equilibrium constant indicated regarding the degree of completeness of the reaction? In other words, at equilibrium, are there mostly products, reactants, or relatively large amounts of both? 3. When the calibration graph was prepared, it was assumed that essentially all of the HSCN was combined with Fe3+ to form complex ion. Use the average value for K that you have determined, calculate the amount of HSCN that was not a part of the complex ion for the standard solution which 5.0 mL of KSCN was used. Was the assumption valid? Show all your work. 4. Explain what a spectrophotometer is and what it measures. Describe how the “standard” solutions were used to determine concentrations of unknown solutions. 5. When you use a spectrophotometer, should you set the wavelength of light to be the same color as that of the solution, or would a different color be more appropriate? Explain. Using other reference sources like the textbook or the Internet, what was the color of light chosen for this experiment? What was the color of the FeSCN2+ complex ion? 6. What degree of precision (how many significant figures) can you obtain with the spectrophotometer used? What is the major source of error? 7. Suggest other experiments in which a spectrophotometer would be useful? Conclusion: 1. Summarize what you have learned from this lab. 2. Explain why a spectrophotometer is so useful in this experiment. Page 6 of 6.
