the Ford Motor Company stock report
advertisement
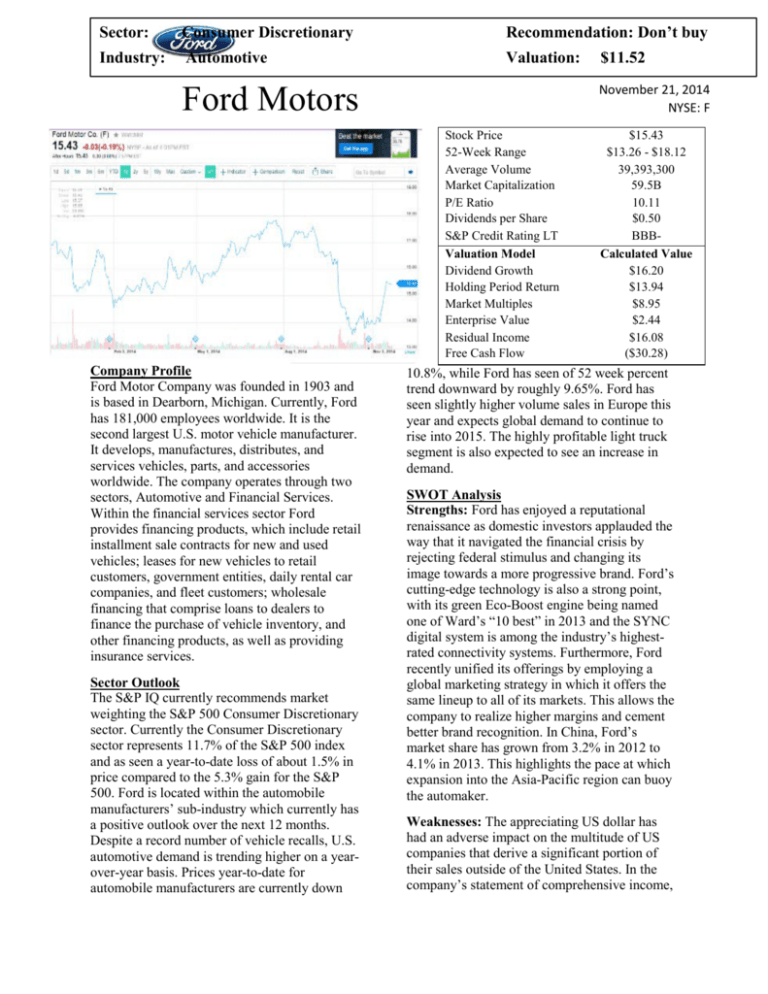
Sector: Consumer Discretionary Recommendation: Don’t buy Industry: Automotive Valuation: November 21, 2014 NYSE: F Ford Motors Stock Price 52-Week Range Average Volume Market Capitalization P/E Ratio Dividends per Share S&P Credit Rating LT Valuation Model Dividend Growth Holding Period Return Market Multiples Enterprise Value Residual Income Free Cash Flow Company Profile Ford Motor Company was founded in 1903 and is based in Dearborn, Michigan. Currently, Ford has 181,000 employees worldwide. It is the second largest U.S. motor vehicle manufacturer. It develops, manufactures, distributes, and services vehicles, parts, and accessories worldwide. The company operates through two sectors, Automotive and Financial Services. Within the financial services sector Ford provides financing products, which include retail installment sale contracts for new and used vehicles; leases for new vehicles to retail customers, government entities, daily rental car companies, and fleet customers; wholesale financing that comprise loans to dealers to finance the purchase of vehicle inventory, and other financing products, as well as providing insurance services. Sector Outlook The S&P IQ currently recommends market weighting the S&P 500 Consumer Discretionary sector. Currently the Consumer Discretionary sector represents 11.7% of the S&P 500 index and as seen a year-to-date loss of about 1.5% in price compared to the 5.3% gain for the S&P 500. Ford is located within the automobile manufacturers’ sub-industry which currently has a positive outlook over the next 12 months. Despite a record number of vehicle recalls, U.S. automotive demand is trending higher on a yearover-year basis. Prices year-to-date for automobile manufacturers are currently down $11.52 $15.43 $13.26 - $18.12 39,393,300 59.5B 10.11 $0.50 BBBCalculated Value $16.20 $13.94 $8.95 $2.44 $16.08 ($30.28) 10.8%, while Ford has seen of 52 week percent trend downward by roughly 9.65%. Ford has seen slightly higher volume sales in Europe this year and expects global demand to continue to rise into 2015. The highly profitable light truck segment is also expected to see an increase in demand. SWOT Analysis Strengths: Ford has enjoyed a reputational renaissance as domestic investors applauded the way that it navigated the financial crisis by rejecting federal stimulus and changing its image towards a more progressive brand. Ford’s cutting-edge technology is also a strong point, with its green Eco-Boost engine being named one of Ward’s “10 best” in 2013 and the SYNC digital system is among the industry’s highestrated connectivity systems. Furthermore, Ford recently unified its offerings by employing a global marketing strategy in which it offers the same lineup to all of its markets. This allows the company to realize higher margins and cement better brand recognition. In China, Ford’s market share has grown from 3.2% in 2012 to 4.1% in 2013. This highlights the pace at which expansion into the Asia-Pacific region can buoy the automaker. Weaknesses: The appreciating US dollar has had an adverse impact on the multitude of US companies that derive a significant portion of their sales outside of the United States. In the company’s statement of comprehensive income, Ratio Analysis Current Ratio Inv. Turnover Net Profit Margin Debt-to-Assets Return on Equity Asset Turnover Interest Coverage Dupont Analysis NI/S S/A 1/(1-D/A) ROE Ford GM 6.74 19.06 4.87% 0.87 27.12% 0.73 9.45 4.87% 0.73 7.56 27.12% adjustments for foreign currency fluctuations were measured at a loss of 3.5% of net income. Ford has also experienced a decline in European unit sales from 18 million in 2007 to 13.8 million in 2013, the US has largely recovered losses experienced directly following the crisis. Opportunities: Since 2008, the automotive industry has experienced a change in consumer tastes away from gas-guzzling trucks and SUVs towards more fuel-efficient machines. Vehiclebuyers are favoring the Ford’s recent truck models, including the 2015 Ford F-150, which offers the best fuel efficiency of any full-size truck. By utilizing aluminum to make its cars lighter, the company has been able to hasten its compliance with Obama’s 2025 EPA standards. Threats: Given the recent underperformance of oil due to expanding domestic supply and OPEC’s stern production outlooks, lower gasoline prices could be an underlying trend over the next several years. The domestic shale boom has supplemented global supply and could threaten Ford’s eco-initiative that is most effective under when prices are high at the pump. Foreign currency fluctuations can hurt the company moving forward. Ratio Analysis Some of Ford’s ratios seem to be in line with most of their nearest competitors, with their Net Profit Margin and Total Asset Turnover falling within the general range of their competitors. However, their ROE, Current, Interest Coverage, Debt-to-Asset, and Inventory Turnover Ratios are much larger than their competitors. These discrepancies can be explained by Ford’s highly leveraged business model. The majority of their Toyota 1.69 11.07 3.44% 0.74 12.55% 0.93 23.33 7.10 13.56 7.10% 0.63 11.98% 0.62 116.77 Kia 2.59 10.99 8.02% 0.44 18.85% 1.32 35.43 leve rage is in lon gter m 3.44% 7.10% 8.02% sec 0.93 0.62 1.32 uriti 3.90 2.72 1.79 es 12.55% 11.98% 18.85% rath er than short term as evidenced by their current ratio. Ford also has a higher ROE and lower Interest Coverage Margin than the other competitors since the equity portion of their balance sheet is so much smaller. Ford’s business model and goal is to turn over their inventory as quickly and as many times as possible in order to make up for the significantly lower gross and net profit margins experienced by the US companies. This presents a risky situation since their Interest coverage ratio is so low in comparison to their competitors and they are at a much higher risk of defaulting on that debt. Pricing Models We valued Ford’s stock with six different pricing models: dividend growth, holding period return, market multiples, enterprise value, residual income and free cash flow. All information was extracted from Bloomberg and confirmed with Standard and Poor’s Capital IQ, Yahoo! Finance, and Morningstar. In our analysis we encountered one primary outliers: The free cash flow model. Because of Ford’s recent financial troubles, they have a negative current free cash flow, which resulted in a negative valuations. In order to eliminate it as a potential outlier, we have removed the free cash flow model to arrive at a value of $11.52. Recommendation The pricing models suggest that Ford is overvalued, due to an analysis calculating a value of $11.52 per share, but trading between $15 and $16 per share. Therefore, due to the quantitative and qualitative analysis, we do not recommend investing in Ford at this time.

