IMPROVED GENERATOR PERFORMANCE UTILIZING ONSITE
HYDROGEN GENERATION AND CONTROL
FPL RIVIERA POWER PLANT – CASE STUDY
Authored and presented at PowerGen International Conference, Orlando, FL Nov. 2006,
By: John Speranza, Proton Energy Systems and Eric Else, Florida Power & Light
Proton Energy
Systems, Inc., a
subsidiary of
Distributed Energy
Systems Corp, designs,
manufactures and
installs HOGEN®
hydrogen generation
systems for industrial
and government
customers worldwide.
Since our founding in
1996, we have installed
over 750 systems in 50
countries around the
world.
Proton Energy Systems, Inc.
10 Technology Dr.
Wallingford, CT
06492 USA
PH: 203.949.8697
FX: 203.949.8016
HOGEN, StableFlow, Proton Energy and the Proton
symbol are registered trademarks of Proton Energy
Systems, Inc.
© 2006 Proton Energy Systems Inc., all rights reserved.
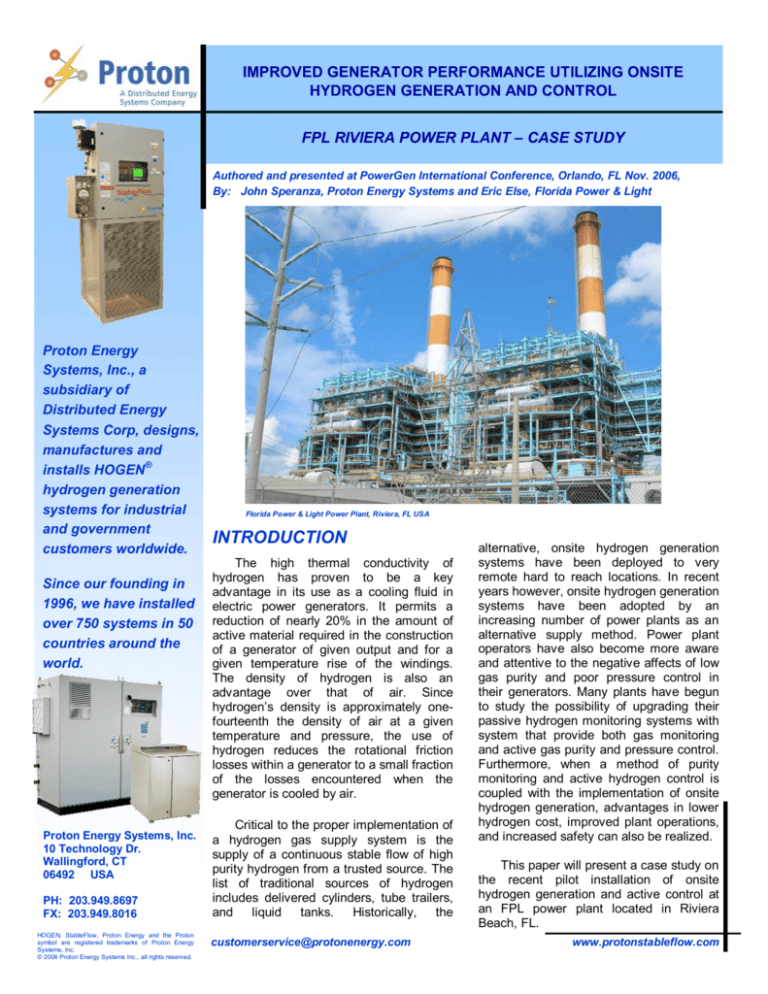
Florida Power & Light Power Plant, Riviera, FL USA
INTRODUCTION
The high thermal conductivity of
hydrogen has proven to be a key
advantage in its use as a cooling fluid in
electric power generators. It permits a
reduction of nearly 20% in the amount of
active material required in the construction
of a generator of given output and for a
given temperature rise of the windings.
The density of hydrogen is also an
advantage over that of air. Since
hydrogen’s density is approximately onefourteenth the density of air at a given
temperature and pressure, the use of
hydrogen reduces the rotational friction
losses within a generator to a small fraction
of the losses encountered when the
generator is cooled by air.
Critical to the proper implementation of
a hydrogen gas supply system is the
supply of a continuous stable flow of high
purity hydrogen from a trusted source. The
list of traditional sources of hydrogen
includes delivered cylinders, tube trailers,
and liquid tanks.
Historically, the
customerservice@protonenergy.com
alternative, onsite hydrogen generation
systems have been deployed to very
remote hard to reach locations. In recent
years however, onsite hydrogen generation
systems have been adopted by an
increasing number of power plants as an
alternative supply method. Power plant
operators have also become more aware
and attentive to the negative affects of low
gas purity and poor pressure control in
their generators. Many plants have begun
to study the possibility of upgrading their
passive hydrogen monitoring systems with
system that provide both gas monitoring
and active gas purity and pressure control.
Furthermore, when a method of purity
monitoring and active hydrogen control is
coupled with the implementation of onsite
hydrogen generation, advantages in lower
hydrogen cost, improved plant operations,
and increased safety can also be realized.
This paper will present a case study on
the recent pilot installation of onsite
hydrogen generation and active control at
an FPL power plant located in Riviera
Beach, FL.
www.protonstableflow.com
FPL RIVIERA POWER PLANT – CASE STUDY
CASE STUDY
BACKGROUND
FPL is one of the
largest
and
fastest
growing utilities in the
nation.
The utility
projects an average
increase of more than
80,000
customers
annually
and
has
approximately
24,000
Riviera’s Unit 3
megawatts of generation
as of 2005. Engineers at FPL’s Juno Beach headquarters
initiated a technology evaluation program of an onsite
hydrogen generation and control system designed to
improve the overall efficiency of the electric power
generating assets at the Riviera Power Plant.
FPL’s Riviera Plant was commissioned in 1946 with
Unit 1, which provided what was then a much needed 40
megawatts to the Riviera Beach community. Unit 2 came
on line with yet another 70 megawatts of capacity in 1953
and both units continued to operate until 1985, when they
were retired. Riviera's two active generating units - 3 and
4 – came on line in 1962 and 1963 respectively and are
capable of producing 580 megawatts of electricity. Both
units burn either natural gas or fuel oil to produce
electricity to supply approximately 136,360 customers.
that utilizes plant de-mineralized water and standard
single phase 240 VAC power to generate Ultra-High
Purity (UHP) hydrogen on demand as it is needed to
maintain pressure, purity, and dew point within the electric
power generator casing.
The hydrogen gas monitoring and control system that
was installed is an innovative product that monitors the
hydrogen within the generator casing and actively
controls the purity, dew point, and pressure within
operator preset values that represent the generator OEM
specifications. The systems were easily installed and did
not require a plant outage to integrate into the existing
plant infrastructure. Figure 1 below depicts a typical
general equipment arrangement within the plant.
PRE-EVALUATION OPERATIONS
Riviera Power Plant operations personnel maintained
hydrogen within Unit 3’s casing by manually introducing
hydrogen from cylinders once per shift. The hydrogen gas
pressure varied between five or ten psig from the
specified casing pressure. Hydrogen gas purity was
consistently above 98% and a manual purge was initiated
whenever the purity dropped below 97%.
The plant maintains 60-100 gas cylinders on site to
provide purity purge gas when needed and refill the unit
after an outage. Prior to installation, about fifteen
cylinders per week were rotated through the storage
facility and transported to the respective hydrogen
manifolds for daily usage requirements. Hydrogen
cylinder gas average costs for Florida range from
$4/100cf to $8/100cf with the majority of hydrogen costs
associated with the filling, transportation, and rental of the
cylinders themselves.
EQUIPMENT INSTALLATION
A Proton Exchange Membrane (PEM) onsite
hydrogen generator manufactured by Proton Energy
Systems was installed on Riviera’s Unit#3 September 14,
2006 along with a hydrogen gas monitoring and active
control system. The onsite hydrogen generator is
designed as a fully integrated hydrogen supply solution
Figure 1 – Typical Power Plant Arrangement
Figures 2 and 3 below show the physical locations within
the Riviera Power Plant where the onsite hydrogen
generator and hydrogen monitoring and control system
were installed.
Figure 2 – Onsite
Hydrogen Generator
Figure 3 – Hydrogen Control System
Proton Energy Systems, Inc., 10 Technology Drive, Wallingford, CT 06492 PH: 203.949.8697 FX: 203.949.8016 customerservice@protonenergy.com www.protonstableflow.com
2
Riviera Power Station Onsite Hydrogen Generation and
StableFlow Hydrogen Control System Evaluation Test Plan
EVALUATION TESTING
1
Plant Baseline
2
Introduce Onsite
Hydrogen Supply
3
Laboratory Gas
Analysis Sample
4
Introduce CO2 to
Generator Casing
to Lower Purity at
Rated Casing
Pressure
5
Mode of
Operation
Monitoring
Only
Hydrogen
Supply
Method
Batch
Feed
Monitoring
and Control
Continuous Feed
Data Logged
by
PI and S/F
Systems
Purity, Pressure,
Dew point,
Electrical load,
Fuel Consumption, Blower
differential pressure, Generator
temps, Coolant
temp in, Coolant
temp out, Coolant flow
Introduce CO2 to
Generator
Casing to Lower
Purity at Lower
Casing Pressure
Table 4 – Evaluation Test Plan
FPL - Riviera Plant Initial Monitoring
54.0
101.0
52.0
100.0
50.0
99.0
48.0
46.0
98.0
44.0
97.0
42.0
40.0
96.0
38.0
Power Generator H2 Press. (psig)
The initial baseline testing was
conducted with the hydrogen monitoring
and control system set up for continuous
sampling with the control function turned
off. The data that was collected over a one
week period showed that the pressure
within the generator casing was fluctuating
as much as 5 psig. This fluctuation was
the result of the “batch hydrogen feed”
operation the plant was using to maintain
hydrogen within the generator. Hydrogen
purity was consistently greater than 98.5%
during the monitoring period and hydrogen
dew point was recorded to be between
+16 and +24 degrees Fahrenheit. Figure
5A and 5B illustrate the results of the initial
baseline testing. An initial gas sample was
taken and sent to a laboratory for analysis
by gas chromatography. The results of the
analysis are presented in Table 5C.
The onsite hydrogen generator was
put online and configured to supply a
continuous flow of UHP hydrogen at the
desired generator casing pressure in test
period #2. Generator casing pressure was
monitored and recorded.
Figure 6A
illustrates the improvement to pressure
stability that was observed.
Description
Power Generator H2 Purity (%)
TEST RESULTS
Period
95.0
36.0
Figure 5a – Baseline
Purity and Pressure
94.0
34.0
0
10
20
30
40
50
60
70
80
90
Data Pt (Hourly)
H2 Purity
H2 Pressure
FPL - Riviera Plant Initial Monitoring
25.0
20.0
H2 Dew Point (°F)
The proposed test plan for evaluating
the hydrogen generation system and
hydrogen control system is presented in
Table 4 below. The test plan was
designed to demonstrate the benefits of
both systems in the power plant
environment under actual generator
operating conditions. A baseline was
established
by
monitoring
typical
generator conditions under normal plant
operations. The second testing period
introduced a continuous supply of UHP
hydrogen that was being generated from
the onsite hydrogen generator. The
electric power generator was then
subjected to two sub-optimum operating
conditions while the hydrogen control
system monitored and actively controlled
the hydrogen atmosphere within the
generator casing
15.0
10.0
5.0
Figure 5b – Baseline
Dew Point
0.0
0
10
20
30
40
50
60
70
80
90
Data Pt (Hourly)
Dew Point
Proton Energy Systems, Inc., 10 Technology Drive, Wallingford, CT 06492 PH: 203.949.8697 FX: 203.949.8016 customerservice@protonenergy.com www.protonstableflow.com
3
FPL RIVIERA POWER PLANT – CASE STUDY
Figure 5c – Results of Initial Gas Analysis
Hydrogen Pressure Hourly Data
FPL - Riviera Plant, Initial Monitoring, Bottle Gas Batch Feed
and subsequent HOGEN / StableFlow Operations
FPL 94% Purity Reduction
55
55
HOGEN / StableFlow
Operations Normalized
(psig):
Min = 44.6
Max = 45.8
Average = 45.3
St. Dev. = 0.27
OEM Target = 45 psig
49
51
49
47
47
45
45
43
43
41
41
39
39
37
37
35
35
0
20
40
60
80
100
120
140
160
180
101.0
53
200
Data Pt (Hourly)
Batch Feed H2 Pressure
Normalized H2 Pressure
Figure 6a – Pressure Stability Improvement
CO2 gas was used to lower the hydrogen purity in the
generator to 94% at 45 psig while being monitored and
controlled for test period #4. The hydrogen purity was
gradually improved during a ten day period as illustrated
in Figure 6b below. The pressure within the generator
casing remained stable and consistently within
specification during the purity improvement period.
100.0
99.0
H2 Purity (%)
51
HOGEN /StableFlow
Normalized H2 Pressure (psig)
Initial Monitoring
Pressure (psig):
Min = 40.6
Max = 45.5
Average = 43.6
St. Dev. = 1.04
OEM Target = 45 psig
53
Batch Feed H2
Pressure (psig)
102.0
98.0
97.0
96.0
95.0
94.0
93.0
0
50
100
150
200
250
300
350
400
Data Pt (Hourly)
H2 Purity
Figure 6b – Purity Improvement Test
The hydrogen gas pressure was lowered to 35 psig
for a one week period and internal generator
temperatures were monitored and logged to determine if
gas pressure has an affect on cooling efficiency for test
period #5. Figure 7 below illustrates the affect pressure
has on generator temperatures. As illustrated, the delta
temperature of the stator coolant inlet and outlet was
measurably higher when the generator pressure was
lower. This condition becomes important when the plant is
Proton Energy Systems, Inc., 10 Technology Drive, Wallingford, CT 06492 PH: 203.949.8697 FX: 203.949.8016 customerservice@protonenergy.com www.protonstableflow.com
4
at full load and cannot provide the maximum possible
generating capacity of the generator due to temperature
limitations.
60
250
50
Gross MW
200
40
Delta T @ Low
Pressure
150
30
100
20
Delta T @ High
Pressure
50
10
0
0.00
0
20.00
40.00
35 Psig Gross MW
60.00
80.00
45 Psig Gross MW
100.00
120.00
35 Psig Temp Delta
140.00
Stator Cooling Oil Inlet (°C) and Stator Cooling Oil Inlet
and Outlet Temp. Delta (°C)
FPL Plant Data - 45 Psi Vs 35 Psi
Gross MW and Cooling Oil Temperature Delta
300
160.00
45 Psig Temp Delta
Figure 7 – Pressure vs Temperature
Measurements were taken during both test periods #4
and #5 to determine if there are any measurable affects
on generator efficiency due to operating the generator at
lower than specified hydrogen gas purity. The
measurements that were taken show possible
improvements to fuel flow, but due to the many variables
that affect fuel flow in a steam plant it is impossible to
determine what percentage is related to purity
improvements. The chart pictured in Figure 8 is based on
data provided by the Original Equipment Manufacturer
(OEM) to illustrate the effect hydrogen gas purity has on
Riviera’s unit #3 and #4. The chart shows that there is a
280kW loss with a hydrogen gas purity of 94% within the
generator casing. The annual impact to Riviera Plant, if
they operated their generator at this suboptimum level,
could be as much as 2480 MWh lost.
It is important to understand that every electric power
generator model has a specific purity vs loss curve. The
generator OEM should be consulted to understand how
hydrogen gas purity affects the efficiency of the specific
electric power generator under consideration.
SUMMARY
The introduction of onsite hydrogen generation and
hydrogen control at FPL’s Riviera Plant has demonstrated
of improvements to the overall operation of the plant. A
power plant that chooses to utilize onsite hydrogen
generation will own a source of hydrogen to provide
cooling gas to its generators at a low cost. A typical
electrolyzer will consume less than 20 gallons a day of
de-mineralized water and consume approximately 17kWh
of electricity for every 100 cubic feet of hydrogen
produced.
Continuously monitoring the hydrogen gas within the
generator casing and actively controlling the quality of
that gas at the Riviera Plant has proven to be a valuable
piece of plant hardware. The affects on generator
efficiency and capacity are measurable in most cases.
The product testing and evaluation at the plant is still
ongoing and will continue throughout the year. Areas
such as fuel conservation and emissions reduction are
certainly areas that deserve a closer and more detailed
investigation. The impact of these improvements to the
plant and to FPL’s utility system can add up to significant
economic returns on the capital investment of this
innovative technology.
ACKNOWLEDGEMENTS
John Speranza is Vice President of Commercial Sales at Wallingford,
Conn.-based Proton Energy Systems, Inc.
Eric Else is an Engineer at FPL Headquarters, Juno Beach, FL.
Special thanks to Ken Stenroos of FPL for sponsoring the evaluation at
Riviera Power Plant. Ken is PGD Electrical Team Manager at FPL
headquarters, Juno Beach, FL.
Special thanks to the skilled and dedicated plant personnel of Riviera
Power Plant for their support and assistance in evaluating onsite
hydrogen generation and control.
Special thanks to Bill Bailey and Angelo Morson for their efforts in
supporting the testing conducted at Riviera Power Plant, collecting data,
and generating support documentation for this report. Bill Bailey and
Angelo Morson are Senior Product Development engineers employed by
Proton Energy Systems, Inc.
Figure 8 – Hydrogen Purity vs Efficiency
Proton Energy Systems, Inc., 10 Technology Drive, Wallingford, CT 06492 PH: 203.949.8697 FX: 203.949.8016 customerservice@protonenergy.com www.protonstableflow.com
5
FPL RIVIERA POWER PLANT – CASE STUDY
Proton Energy Systems, Inc., 10 Technology Drive, Wallingford, CT 06492 PH: 203.949.8697 FX: 203.949.8016 customerservice@protonenergy.com www.protonstableflow.com
6


