Completion and Production
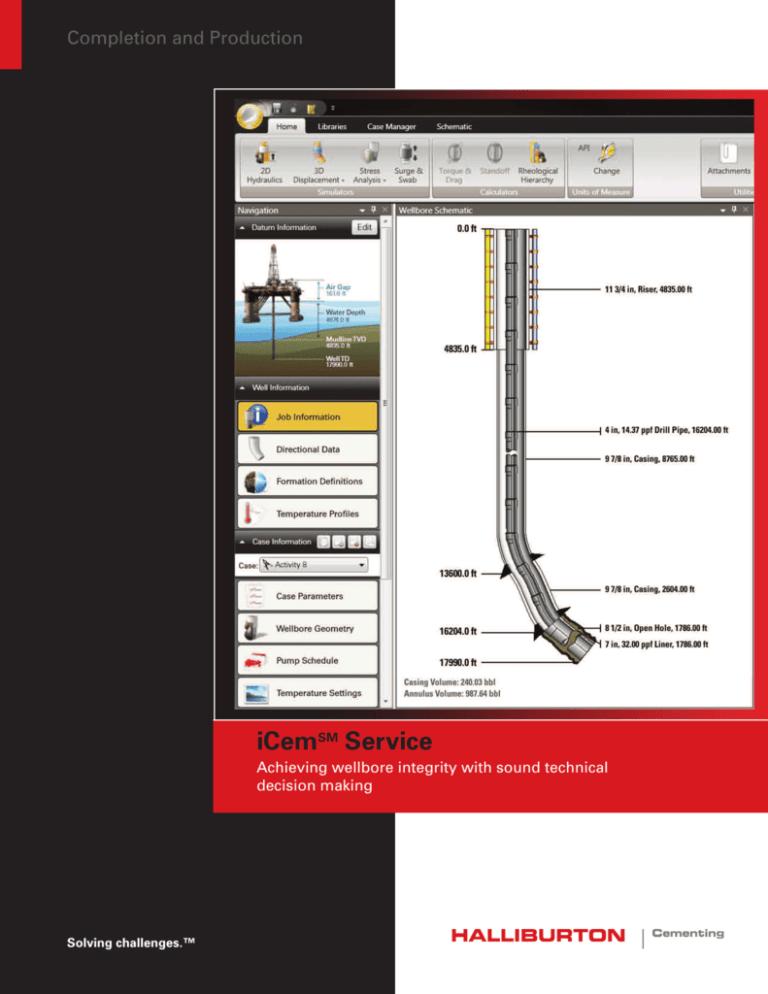
iCemSM Service
Achieving wellbore integrity with sound technical
decision making
Solving challenges.™
iCemSM Service
Achieving wellbore integrity with sound technical decision making
Wellbore architecture challenges are complex and every cementing job presents technical and operational challenges.
With iCemSM service, Halliburton offers an advanced way to work collaboratively with operators to increase the
probability of wellbore-integrity success. iCem service is a comprehensive cementing design tool to assess and monitor
specific variables before, during and after a cement job in order to help reduce operational risk and increase
operational success.
Key wellbore architecture design data derived from a collaborative process between the operator and the service
company can be entered in to the iCem service tool and used to run various simulations or calculations including:
Two-dimensional Equivalent Circulating Density
(ECD) hydraulic simulation
Three-dimensional spacer and
cement placement simulation
Cement sheath stress analysis is a finite element analysis model to predict the risk of cement
failure during various stress-inducing operations to generate thermal and mechanical
properties required to retain zonal isolation
Tracking surge pressure against the fracture gradient and swab pressure
against pore pressure according to casing shoe measured depth
Optimize fluid rheologies by assessing the likelihood of fluid
bypass based on pressure drop versus flow rate for each
successive fluid
Centralization optimizer includes plot detailing
standoff of each centralizer and the mid-point
Rotational torque, slackoff weight, static weight and pickup
weight as a function of casing shoe measured depth
These variables can be assessed individually and collectively for primary cementing, reverse cementing, balanced plugs,
or a post-cementing-operation analysis to name just a few. Different results can be compared simultaneously for
vigorous design evaluation. This enables continual improvement through post-job analysis to help optimize future
designs.
1
iCemSM Service – Available Results*
Animated 2D Fluid Positions
Wellbore schematic displaying fluid movement playback during job simulation with various calculated
surface and downhole values (pressure, density, rate, hole cleaning, etc) by depth and time.
Interactive 3D
Displacement Visualizer
Three-dimensional visualization tool-kit with pipe and annular intermixing concentration
views over time, including a displacement efficiency plot.
Stress Analysis Summary
WellLife® Remaining Capacity charts and optimal (and user entered) mechanical properties
required to withstand well construction, completion and production stresses.
Balanced Plug Snapshot
Wellbore schematic showing the height of all fluids in place at the end of the job.
Flow Potential
Predicts formation fluid flow potential before or immediately after cement is in place.
Critical Static Gel Strength (CSGS) Plot
Determine the required cement static gel strength time period.
Erodibility Profile
Shows effectiveness of spacer at cleaning gelled mud out of the annulus.
Pressure to Break Circulation Plot
Pressure required to break gelled mud circulation in comparison to weak zone fracture gradient to
avoid formation breakdown. Can casing be run all the way to total depth before breaking circulation
or must circulation be broken in stages while running the casing?
Critical Velocity Data Table
Reports Reynolds numbers required to achieve turbulence at multiple wellbore depths.
Time of Events Summary
Snapshot of events and stages encountered during the job simulation.
Pressure Imbalance at
Conclusion of Job
Horsepower, Pressure,
& Freefall Data Table
Custom X-Y graph
Pressure across the plug.
Includes horsepower, ECDs, and freefall intervals during the job simulation.
Create custom plots with any of the simulated or entered variables
Custom Numerical Dashboard
Display
Display of real-time data acquired from the rig operations for monitoring during the actual job.
Data Listing
Ability to export all raw data (design and real time) to Microsoft Excel® for further evaluation.
ECD & Hydrostatic Pressure Plot
Circulating pressure and hydrostatic pressure over job simulation plotted at multiple weak zones
(fracture zones) and overpressure zones (pore pressure zones).
Calculated Surface Pressure Plot
Wellhead and pump pressure including surface iron.
Job Summary Plot
Four job variables (ECD, surface pressure, density, and rate) on one plot.
Downhole Pressure Profiles Plot
Prediction of minimum and maximum pressures throughout the entire job to help stay within
fracture gradient and pore pressure at all depths.
Final Density & Hydrostatic
Profile Plot
For foam jobs, shows final in-place slurry density and cumulative hydrostatic pressure
at every depth.
Temperature Profile Plot
Casing and annulus temperature profile evolution with undisturbed (geothermal) temperature baseline
over job simulation plotted at all depths illustrating the calculated dynamic temperature profile.
Slurry Placement Temperatures Plot
Temperature tracker for first sack of lead cement, first sack of tail cement, and last sack of tail cement.
Rate In & Rate Out Plot
Rates in and out used to illustrate the expansion and compression of foamed fluids as well as the
affects of free fall.
Rheological Hierarchy Plot
Comparison of the pressure drop versus flow rate for each successive fluid to help ensure correct
alignment or prediction of the likelihood of spacer bypassing mud, spacer bypassing cement, etc.
Hookload Plot
Standoff Plot
Torque Plot
Simulates hook load throughout job simulation.
Drag Plot
Includes slack-off weight, static weight, pickup weight as a function of casing shoe measured depth.
Surge & Swab Pressures Plot
Surge pressure tracked against the fracture gradient and swab pressure tracked against the pore
pressure, at every depth, as a function of casing shoe measured depth going in or coming out.
Downhole Surge & Swab Profiles Plot
Surge pressure and swab pressure as a function of well depth compared to the fracture
and pore pressure gradients.
Centralizer placement, standoff at each centralizer, and standoff at mid-point between centralizers.
Simulation of rotational torque applied to the casing during installation into the wellbore.
*Results support meeting or exceeding API 65-2 specifications.
2
iCemSM Service
iCemSM Service – Three-Dimensional Displacement Simulation
Based on computational fluid dynamics, the 3D simulator
models multiple aspects of mud displacement during
cementing and demonstrates the effect of the key
mud-displacement variables that affect successful cement
placement.
• Models the mud/spacer/cement interfaces over time
within the wellbore environment at all depths to help
determine optimum fluid designs
• Uses rheological data including fluid compatibility
tests and best-fit rheological models
The simulator is formulated on general curvilinear
coordinate mesh system whose boundaries can conform to
highly eccentric annuli and/or localized washout to help:
• Predict the amount of required spacer and cement
volumes to avoid contamination and to achieve top
of cement (TOC)
• Determine optimum casing stand off to reduce
the probability of channeling
• Determine optimum pump rate for successful cement
placement
• Determine impact of pipe rotation and reciprocation
to reduce channeling and achieve desired top of cement
The same data can be represented both in a graph (above) or
a cross section of the well (below) to help determine a volume
of each fluid for optimized displacement. Notice the 70% of
cement (red) in the graph above correlates to the 70% coverage
below. In this example further iterations are required to develop
a design that eliminates channeling.
Fluids can be assessed at any cross section of the well at any
given time. This helps determine fluid volumes necessary to
achieve optimal displacement efficiency and minimize
cement contamination.
3
iCemSM Service – Two-Dimensional Hydraulic Simulation
iCem service provides a comprehensive suite of hydraulic modeling for simulating cementing operations:
• Equivalent Circulating Density (ECD) management
• Surge and swab
• The effect of dynamic temperature on fluid properties
• Mud removal and erodibility
• Pump schedule design with and without foam cement
along with automatic calculation of cement sacks
required to achieve top of cement (TOC)
• Advanced rheological modeling
• Balanced plug with or without stinger
• Standoff
• Integrated fluid-flow potential calculations
• Complex land and offshore wellbore geometry designs
• Automatic pump rate adjustment to stay below
fracture gradient
• Torque and drag
Dynamic temperature modeling allows a more accurate design of cement slurries for complex downhole environments by
enabling temperature-evolution via heat-transfer modeling.
Chart on the left is an interactive graph over the entire job
time showing casing and annular temperature profiles
including bottom-hole circulating temperature.
Chart on the right is a temperature tracker over the entire job
time for key cement stages to help enable optimized
laboratory slurry testing prior to the job.
4
iCemSM Service – Cement Sheath Stress Analysis
Wells are subjected to substantial stresses from
operationally induced pressure events and temperature
cycling. The annular seal can succumb to the
cumulative effect of these forces, compromising zonal
isolation and reducing the economics of the well by
inhibiting production and/or requiring costly
remediation. WellLife® service, Halliburton’s original
modeling software is a globally recognized finite element
analysis model to predict the risk of cement failure
throughout the life of the well. The power and reliability
of this software is the foundation for the Cement Sheath
Stress Analysis within iCem service.
Cement failure phenomena that can be modeled include
de-bonding from casing, de-bonding from the
formation, radial cracking, and deterioration. The
Cement Sheath Stress Analysis identifies the probability
of the loss of zonal isolation during various
stress-inducing operations.
The Cement Sheath Stress Analysis simulator can model
various critical phases that the cement is exposed to after
placement including:
• Cement Hydration
• Shoe Pressure Testing
• Fracturing / Stimulation
• Completion Fluid Change Out
• Injection and Production
• Evacuation / Unloading
• Well Kill
Examining the effect of these phases of well operations on
the cement sheath helps design a solution that will help
ensure zonal isolation for the life of the well.
The model simulates the well structure, properties of
formation, and long-term critical well conditions to predict
the competence of a cement sheath. Going further, the
model then generates thermal and mechanical properties
required to survive downhole stress conditions. The
properties revealed in the modeling include Young’s
Modulus, Poisson’s Ratio, shrinkage, thermal expansion,
compressive strength, tensile strength, thermal conductivity,
and specific heat.
The ability to withstand the downhole stresses is presented
via histograms. These charts show the percent of remaining
capacity available before succumbing to a stress-related
cement failure phenomena. If the sheath is shown to have a
high risk of failure, iCem service has a powerful module that
allows modification to the various cement-property options
via the “What If” analysis. This capability allows users to
compare differing solutions, comparing the risk and reward
of the various solution options, in order to create an
optimized solution.
Histograms indicate the remaining capacity of the cement
sheath to withstand cumulative stress and resist failure.
5
iCemSM Service – Real-Time Data Acquisition and Monitoring
Real-time acquisition and monitoring of cementing job data allows a view of the cementing job while it is being run to
monitor the compliance with the plan of the job parameters and make adjustments to further optimize displacement
rates in real time. iCem service is capable of customized charts to present a robust set of data on variables such as
pressure, rate, volume, and density for the cementing job while it is being pumped.
Charts generated in real time provide both a dynamic graph (above left) and numerical display (above right).
During cementing operations, actual job
volumes, densities, pump rates, and
pressures can be compared in real-time
to the pre-job simulation of the job plan.
The raw rig data can be used to calculate
downhole variables such as equivalent
circulating densities (ECDs) at actual
depths and conditions. These “actual vs.
planned” comparisons enable quality
reviews to help optimize future designs.
Comparison of the planned stage slurry volume (red)
versus actual pump totals (blue).
6
iCemSM Service – From the Field
Before
After
Challenge – Middle East
Poor cement bond logs (CBLs) in previous wells in the field.
Solution
Halliburton ran several scenarios and recommended
subsequent wells in the field should rely on the following
plan modifications.
• Increasing casing centralization to 70% standoff
• Modifications to the drilling fluid rheology
• Increase spacer volumes up to 60 barrels
Results
• Dramatically improved cement bond logs
CBLs for iCem service-optimized wells (right) showed
significant improvements over CBLs from previous wells (left).
Challenge – Shale
Highly stressed formation subjecting wells to excessive washout, sloughing shales, stuck pipe, and poor cement jobs.
Solution – The three-dimensional displacement simulation revealed risks of debonding and causes of sheath failure
over time due to wellbore stresses and led to changes:
• Wellbore fluid conditioning
• Optimized centralizer placement for proper standoff
• Cement spacer properties
• Resilient cement sheath mechanical properties to address completion and production wellbore stresses
Results
• After implementing changes, CBL indicated dramatic improvements in placement coverage over previous wells
• Previously required remediation work was avoided
HALLIBURTON
www.halliburton.com
Sales of Halliburton products and services will be in accord solely with the
terms and conditions contained in the contract between Halliburton and
the customer that is applicable to the sale.
H08264
08/11 © 2011 Halliburton. All Rights Reserved.


