THE COMING OF AGE FOR SENIORS HOUSING
advertisement
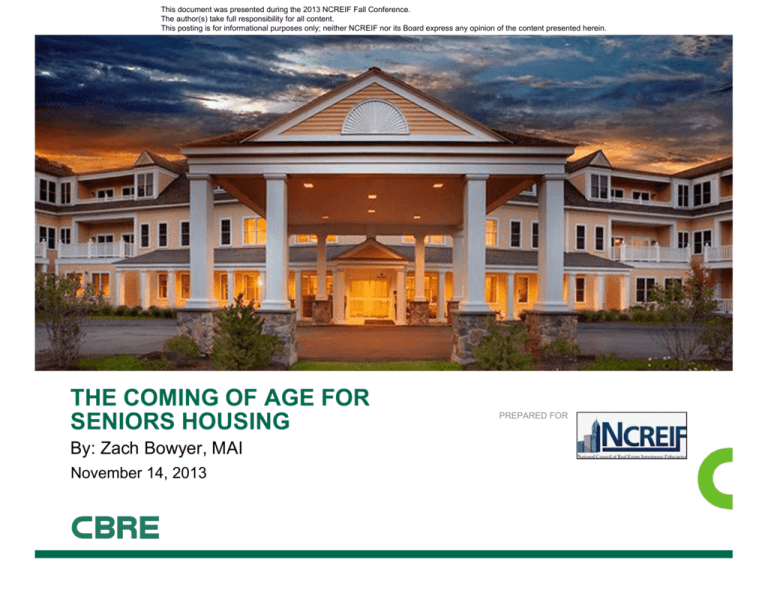
This document was presented during the 2013 NCREIF Fall Conference. The author(s) take full responsibility for all content. This posting is for informational purposes only; neither NCREIF nor its Board express any opinion of the content presented herein. THE COMING OF AGE FOR SENIORS HOUSING By: Zach Bowyer, MAI November 14, 2013 PREPARED FOR This document was presented during the 2013 NCREIF Fall Conference. The author(s) take full responsibility for all content. This posting is for informational purposes only; neither NCREIF nor its Board express any opinion of the content presented herein. PRESENTATION OVERVIEW The Coming of Age for Seniors Housing What Drives Pricing What Drives Value Case Studies CBRE Insights & Outlook Objective: As seniors housing marks its place as a core property type within institutional portfolios, a greater understanding of the sector and more sophisticated approach to operating these assets will allow investors to further diversify their portfolios to achieve higher risk adjusted returns in a changing economic environment. 2 NCREIF | THE COMING OF AGE FOR SENIORS HOUSING | ZACH BOWYER, MAI This document was presented during the 2013 NCREIF Fall Conference. The author(s) take full responsibility for all content. This posting is for informational purposes only; neither NCREIF nor its Board express any opinion of the content presented herein. CBRE: THE GLOBAL MARKET LEADER GLOBAL LEADERSHIP WITH BROAD CAPABILITIES SCALE AND DIVERSITY 3 NCREIF | THE COMING OF AGE FOR SENIORS HOUSING | ZACH BOWYER, MAI This document was presented during the 2013 NCREIF Fall Conference. The author(s) take full responsibility for all content. This posting is for informational purposes only; neither NCREIF nor its Board express any opinion of the content presented herein. CBRE: THE GLOBAL MARKET LEADER GLOBAL LEADERSHIP WITH BROAD CAPABILITIES SCALE AND DIVERSITY VALUATION & ADVISORY SERVICES • 118,400 Assignments World Wide (2012) 60+ Offices in the US and Canada • • 40,000+ US Assignments (2012) • 400+ US Professionals • 130+ MAIs in US 4 NCREIF | THE COMING OF AGE FOR SENIORS HOUSING | ZACH BOWYER, MAI This document was presented during the 2013 NCREIF Fall Conference. The author(s) take full responsibility for all content. This posting is for informational purposes only; neither NCREIF nor its Board express any opinion of the content presented herein. CBRE: SENIORS HOUSING SERVICES HEALTHCARE & SENIORS HOUSING NETWORK VAS SENIORS HOUSING PLATFORM Seniors Housing Specialty Office General VAS Office Seniors Housing Network VAS Seniors Housing Platform • Seniors Housing Debt & Equity Finance ($2 billion) • Specialized Core Seniors Housing Group in US & Canada • Seniors Housing Investment Brokerage ($8 billion) • Operating Exclusivity Throughout CBRE VAS • Healthcare Capital Markets ($3.0 billion) • Specialized Templates and State-of-the-Art Database • Investment Banking • Access to all CBRE Business Lines • Asset Services • Affiliate Coverage in UK, New Zealand, Asia, & India • Financial & Tax Reporting • Best in Class Local Market Knowledge 5 NCREIF | THE COMING OF AGE FOR SENIORS HOUSING | ZACH BOWYER, MAI This document was presented during the 2013 NCREIF Fall Conference. The author(s) take full responsibility for all content. This posting is for informational purposes only; neither NCREIF nor its Board express any opinion of the content presented herein. WHAT DRIVES PRICING Inputs for Real Estate Values To paraphrase Buzz McCoy, real estate valuations are based on the following components: Property Markets Capital Markets Interest Rates Economy As an appraiser, our world revolves around property markets which include property level operations and local market supply and demand fundamentals. 6 NCREIF | THE COMING OF AGE FOR SENIORS HOUSING | ZACH BOWYER, MAI This document was presented during the 2013 NCREIF Fall Conference. The author(s) take full responsibility for all content. This posting is for informational purposes only; neither NCREIF nor its Board express any opinion of the content presented herein. WHAT DRIVES PRICING Cap Rate Trends vs. Apartment Caps & 10-Year Treasury Irrational Exuberance Demographic Influence Rational Market Over Correction REIT Impact Back to Rational Market 14% 12% NC 10% AL IL 8% Apartment 10Y - T 6% 4% 2% 2017 2016 2015 2014 2013 2012 2011 2010 2009 2008 2007 2006 2005 2004 2003 2002 2001 2000 1999 1998 1997 0% Source: NIC MAP & CBRE Econometric Advisors 7 NCREIF | THE COMING OF AGE FOR SENIORS HOUSING | ZACH BOWYER, MAI This document was presented during the 2013 NCREIF Fall Conference. The author(s) take full responsibility for all content. This posting is for informational purposes only; neither NCREIF nor its Board express any opinion of the content presented herein. WHAT DRIVES VALUES Summary of Operating Metrics Seniors housing is primarily valued based on the fee simple interest of the going concern (the operating business). IL AL NC (CA Only) 89.4% 89.1% 87.6% 29.2 Months 21.7 Months 3.2 Months Total Revenues PRD $78.24 $145.07 $268.93 Operating Expenses PRD $38.81 $100.45 $232.23 Operating Margin 41.1% 32.9% 13.6% Average FTE/ Resident 0.26 0.66 0.98 Debt Coverage Ratios 1.5 1.8 --- 6.5% 9.7% 14.8% 29.37% 31.6% --- Occupancy (3Q) Average Length of Stay ROI (Unleveraged) Change in OM (1994-2011) Per Resident Day (PRD) is the most accurate unit of measure when under writing a seniors housing property type. Expense ratio, profit margin, and per unit indicators are all used as secondary measures. Source: NIC MAP, American Seniors Housing Assoc., & Irving Levin Assoc., CBRE Healthcare Investor Survey 8 NCREIF | THE COMING OF AGE FOR SENIORS HOUSING | ZACH BOWYER, MAI This document was presented during the 2013 NCREIF Fall Conference. The author(s) take full responsibility for all content. This posting is for informational purposes only; neither NCREIF nor its Board express any opinion of the content presented herein. CASE STUDY I Operational Value Add Senior Living Investment Nursing Home 120-bed, purpose built skilled nursing facility, developed in 1973, second generation family owned and operated. Good quality property in average condition. Excellent bones and design. Buyer was regional owner-operator with properties MA, NY, NJ, and PA and looking to expand their presence in New England. Buyer contacted the seller directly. No broker on deal. Above market operating expenses. Did not use part time staff - paid overtime to full employees. Below market occupancy and quality mix- recognized by seller. Property Summary Below market private pay rates – recognized by buyer. Year Built 1973 Not maximizing Medicare utilization. Beds 120 Care Level SNF Favorable rated market by NIC MAP in high barrier to entry location in close proximity to a number of hospitals. Purchased $6,000,000 Seller executed with buyer due to comfort level and trust. Date June 2013 2012 NOI $273,006 Buyer’s short term goal to increase operating efficiencies. Invest an additional $3mm and offer more sub acute rehab services. Buyer Y2 NOI $2,623,908 Seller’s goal - retire. 9 NCREIF | THE COMING OF AGE FOR SENIORS HOUSING | ZACH BOWYER, MAI This document was presented during the 2013 NCREIF Fall Conference. The author(s) take full responsibility for all content. This posting is for informational purposes only; neither NCREIF nor its Board express any opinion of the content presented herein. CASE STUDY I OPERATING SUMMARY 2012 Actual (Seller) Reporting Period Tota l Beds Occ. AMR 120 76% Total Year 1 (Buyer) Res Days Beds Occ. AMR $6,111 33,384 120 87% % EGI $/ Unit $/ RD Total Year 2 Stabilized (Buyer) Res Days Beds Occ. AMR $7,489 37,979 120 92% $8,074 Res Days 40,150 % EGI $/ Unit $/ RD Total % EGI $/ Unit $/ RD $43.64 Income Skilled Nursing Private Pay $1,245,924 14.1% 10,383 $37.32 $1,635,200 15.0% 13,627 $43.06 $1,752,000 14.9% 14,600 Skilled Nursing Medicaid 4,094,967 46.4% 34,125 122.66 4,578,034 42.0% 38,150 120.54 4,439,147 37.8% 36,993 110.56 Skilled Nursing Medicare 2,960,407 33.5% 24,670 88.68 3,749,280 34.4% 31,244 98.72 4,407,375 37.5% 36,728 109.77 497,965 5.6% 4,150 14.92 822,256 7.5% 6,852 21.65 1,027,694 8.7% 8,564 25.60 32,436 0.4% 270 0.97 124,885 1.1% 1,041 3.29 124,885 1.1% 1,041 $73,597 $264.55 $90,914 $287.25 Skilled Nursing Insurance Ancillary Charges Effective Gross Income Expenses Real Estate Taxes $8,831,699 100.0% $10,909,655 100.0% $11,751,102 100.0% $97,926 3.11 $292.68 $131,274 1.5% 1,094 $3.93 $137,822 1.3% 1,149 $3.63 $137,822 1.2% 1,149 13,712 0.2% 114 0.41 13,772 0.1% 115 0.36 13,772 0.1% 115 0.34 Utilities 237,055 2.7% 1,975 7.10 283,330 2.6% 2,361 7.46 283,330 2.4% 2,361 7.06 Administrative & General 848,181 12.1% 11,858 35.44 1.0% 1,000 2.99 30.8% 30,113 90.00 14.94 Property Insurance $3.43 9.6% 7,068 25.41 1,330,361 12.2% 11,086 35.03 1,422,942 0.0% 0 0.00 120,000 1.1% 1,000 3.16 120,000 4,141,173 46.9% 34,510 124.05 3,416,400 31.3% 28,470 89.95 3,613,500 Ancillary Services 518,596 5.9% 4,322 15.53 550,000 5.0% 4,583 14.48 600,000 5.1% 5,000 Culinary Services 719,014 8.1% 5,992 21.54 607,360 5.6% 5,061 15.99 642,400 5.5% 5,353 16.00 Laundry & Housekeeping 516,977 5.9% 4,308 15.49 379,600 3.5% 3,163 9.99 401,500 3.4% 3,346 10.00 3.74 Advertising & Leasing Resident Care - Repairs & Maintenance 138,760 1.6% 1,156 4.16 140,000 1.3% 1,167 3.69 150,000 1.3% 1,250 Program & Recreation 123,616 1.4% 1,030 3.70 140,000 1.3% 1,167 3.69 140,000 1.2% 1,167 3.49 Payroll Taxes & Benefits 780,541 8.8% 6,505 23.38 580,000 5.3% 4,833 15.27 625,000 5.3% 5,208 15.57 Other Operating Expenses N et Opera ting I ncome Management Fee ¹ 347,794 3.9% 2,898 10.42 350,000 3.2% 2,917 9.22 350,000 3.0% 2,917 8.72 $8,516,693 96.4% 70,972 $255.11 $8,048,645 73.8% $67,072 211.92 $8,500,266 72.3% 70,836 211.71 3.6% 2,625 $9.44 $2,861,010 26.2% 23,842 $75.33 $3,250,835 27.7% 27,090 $80.97 $14.57 $315,006 - 0.0% - $0.00 545,483 5.0% 4,545.69 $14.36 584,928 5.0% 4,874 42,000 0.5% 350.00 1.26 42,000 0.4% 350.00 1.11 42,000 0.4% 350.00 1.05 Adjusted Opera ting Expenses 8,558,693 96.9% 71,322 $256.37 8,636,128 79.2% 71,968 $227.39 9,127,194 77.7% 76,060 $227.33 Adjusted N et Opera ting I ncome $273,006 3.1% $2,273,527 20.8% $59.86 $2,623,908 21,866 $65.35 Reserves for Replacement 2,275 $8.18 18,946 22.3% Source: Property operating statements & buyer proforma 10 NCREIF | THE COMING OF AGE FOR SENIORS HOUSING | ZACH BOWYER, MAI This document was presented during the 2013 NCREIF Fall Conference. The author(s) take full responsibility for all content. This posting is for informational purposes only; neither NCREIF nor its Board express any opinion of the content presented herein. CASE STUDY I Revenue Projections Occupancy Census Mix Subject 100% 76.00% Comps NIC Metro 60% 90.10% NIC 31 91.40% Buyer 60% 8% 21% 19% 22% 14% 11% 13% 13% Other Medicare Private 61% 60% 59% 57% Subject Comps Buyer Current Medicaid 0% 80% 100% Daily Private Pay Rates Subject 9% 20% 85.00% 40% 8% 40% 92.00% Current 20% 80% 91.00% 8% 17% Effective Gross Income Per Resident Day $300 $265 Comps $363 NIC Metro $250 $375 NIC 31 $200 $278 Buyer $265 $320 Current $296 $262 $273 $293 $293 Buyer Current $150 $270 $100 $100 $150 $200 $250 $300 $350 Subject $400 Comp Min. Comp Max.Comp Avg. “Subject “data points represent the seller’s 2012 Actual. “Current” represents the buyer’s October 2013 Actual 11 NCREIF | THE COMING OF AGE FOR SENIORS HOUSING | ZACH BOWYER, MAI This document was presented during the 2013 NCREIF Fall Conference. The author(s) take full responsibility for all content. This posting is for informational purposes only; neither NCREIF nor its Board express any opinion of the content presented herein. CASE STUDY I Expense Projections and The Bottom Line Operating Costs Per Resident Day (PRD) Subject Expense Ratio (Before Mgt Fee & Reserves) 100% $255.51 Comp Min. 80% $204.39 Comp Max. 60% $240.32 Comp Avg. $228.06 Buyer 40% $211.92 Current 97% 78% 81% 83% 72% 84% 20% $253.12 0% $100 $150 $200 $250 $300 Subject $350 Profit Margin (Before Mgt Fee & Reserves) Subject Comp Min. Comp Max.Comp Avg. Buyer Current NOI PRD (Before Mgt Fee & Reserves) $70 3.60% $60 Comp Avg. 17.80% Comp Max. $50 22.40% Comp Min. $40 $30 8.60% Buyer $20 27.70% Current $0 0% 5% 10% 15% 20% $32 $10 16.00% 25% 30% $40 $36 $8 Subject 35% $60 $59 Comp Min. Comp Max.Comp Avg. Buyer Current “Subject “data points represent the seller’s 2012 Actual. “Current” represents the buyer’s October 2013 Actual 12 NCREIF | THE COMING OF AGE FOR SENIORS HOUSING | ZACH BOWYER, MAI This document was presented during the 2013 NCREIF Fall Conference. The author(s) take full responsibility for all content. This posting is for informational purposes only; neither NCREIF nor its Board express any opinion of the content presented herein. CASE STUDY I Results At Purchase (June 2013) Current (Oct 2013 Ann.) Buyer’s Stabilized $273,006 $1,108,218 $2,623,908 $6,000,000 $6,000,000 $6,000,000 CapEx & Cary --- --- $3,000,000 Total Cost --- $6,000,000 $9,000,000 N/A $50,000/ Bed $8,500,000 $71,000/ bed $20,200,000 $168k/ bed 4.55% 18.47% 29.15% NOI Purchase Price Indicated Value @ NIC Average Cap Rate Return on Cost The “current” data points detailed in the comparable tables represent four months of property operations by the buyer. 13 NCREIF | THE COMING OF AGE FOR SENIORS HOUSING | ZACH BOWYER, MAI This document was presented during the 2013 NCREIF Fall Conference. The author(s) take full responsibility for all content. This posting is for informational purposes only; neither NCREIF nor its Board express any opinion of the content presented herein. CASE STUDY II Cradle to Grave Value Add Senior Living Investment Senior Living Property by Lincoln Street Capital 130-unit, purpose built seniors property, developed in 1984, and operated as a “seniors apartment building” by a large, public REIT on a 3rd party management contract basis. ADL (activity of daily living) services were provided a la carte through a 3rd party healthcare provider due to HUD regulations. 57-units subsidized by Project Based Section 8, with remaining 73-units not income restricted (but rents were regulated by HUD). Property Summary Year Built 1984 Units 130 Care Level Independent Living Purchased $5,250,000 Cap/ Carry $6,000,000 Sold $19,000,000 Return 20% IRR/ 37% Leverage Deed was encumbered by a Land Use Restriction Agreement governed by HUD restricting all rents and fees charged for meals and services to be approved by HUD. Property was acquired with free and clear title, LURA was terminated, Project Based S8 was Noticed for Termination. 2007 NOI: $267,000 with Weighted Average Revenues/Occupied Unit/Month: $1,501 (Market Comps: $3,000+). Located in high barrier market, top NIC MAP rated, with competitive market occupancy averaging 98%. Rents were concluded to be 80-100% below market on an improved basis. HUD had not approved a rent increase since 1984. 14 NCREIF | THE COMING OF AGE FOR SENIORS HOUSING | ZACH BOWYER, MAI This document was presented during the 2013 NCREIF Fall Conference. The author(s) take full responsibility for all content. This posting is for informational purposes only; neither NCREIF nor its Board express any opinion of the content presented herein. CASE STUDY II Results Acquisition March 2008 Reposition Program 2008 - 2013 Sale October 2013 Reposition Program 2014 (Per OM) - $5.25mm ($40k/ Unit) $6mm in CapEx/ Carry $19mm ($146k/ Unit) $2mm – 3mm CapEx • 68% Occupied • New Management • Carlyle Group • Add AL and MC • $267,000 NOI • Replaced Management • 79% Occupied • Reduce to 128 Units • Rent Restricted • Stalled Housing Market • $1.23mm NOI • Replace Mgt. • $1,501 AMR • Great Recession • 73% Market Rent • +$1.8mm Stabilized NOI • Average Condition • $2,508 AMR • 3rd Party Management • 20% IRR/ 37% Leverage • ROC 11% “ Post-Closing: The Operator has far greater influence over the outcome of the investment than the Investor believes or market supports. ” Christopher Arruda, Lincoln Street Capital, Managing Member 15 NCREIF | THE COMING OF AGE FOR SENIORS HOUSING | ZACH BOWYER, MAI This document was presented during the 2013 NCREIF Fall Conference. The author(s) take full responsibility for all content. This posting is for informational purposes only; neither NCREIF nor its Board express any opinion of the content presented herein. WHAT DRIVES PRICING Major Single Asset Transactions Transaction Description The Arbors of Bedford in Bedford, NH • 50 units and 83 beds MC, constructed in 1998 • $35,808,136 or $431k per bed • Closed March 2013 to LCB Senior Living, LLC • 97% occupied with in place NOI of $33,900/ bed yielding a 7.73% cap rate Arbor Terrace at Crabapple in Alpharetta, GA • 93 units, AL with MC, constructed in 2009 • $32,700,000 or $352k per unit • Closed June 2013 to Prudential Real Estate Investors • 93% occupied with in place NOI of $21,519/ unit yielding a 6.12% cap rate Forge Hill and Inn at Robbins Brook – 2 Assets in MA • 193 units, AL with MC, constructed 1999 and 2002 • $63,500,000 or $329k per unit • Closed November 2013 to Benchmark Senior Living JV with Health Care REIT • 93% occupied with in place NOI of $20,234 unit yielding a 6.15% cap rate • Purchased by seller 2010 at $222k per unit, 8.00% cap, NOI of $17,844/ unit (4.5% YoY) 16 NCREIF | THE COMING OF AGE FOR SENIORS HOUSING | ZACH BOWYER, MAI This document was presented during the 2013 NCREIF Fall Conference. The author(s) take full responsibility for all content. This posting is for informational purposes only; neither NCREIF nor its Board express any opinion of the content presented herein. WHAT DRIVES PRICING Major Portfolio Transactions Transaction Description Bristol Portfolio – Five Properties Located on Long Island, NY • 640 AL and MC units, constructed between 2000 and 2006 • $290,000,000 or $453k per unit • Closed Feb. 2013 to Engel Burman/ Harrison Street by Chartwell & Ingenia Communities • 95% occupied with in place NOI of $31,220/ unit yielding a 6.89% cap rate • Portfolio (totaled 7 properties) was purchased from Engel Burman in 2007 for $290.5mm Health Care REIT (NYSE: HCN) – 120 Properties, UK, US, Canada • 10,000 IL, AL, MC units, average age 8 years • Closed July 2013 • $4.3 billion or $430k per unit, unlevered NOI Yield of 4% to 5% (long term) • Retain Management • Stabilized at purchase, average rent 100% above industry average CNL Healthcare Portfolio – 12 Properties, 5 States, in Pacific Northwest • 2,186 IL, AL, MC units • Closed October 2013 • $457.3mm or $210k per unit • Replace management • Not stabilized at purchase 17 NCREIF | THE COMING OF AGE FOR SENIORS HOUSING | ZACH BOWYER, MAI This document was presented during the 2013 NCREIF Fall Conference. The author(s) take full responsibility for all content. This posting is for informational purposes only; neither NCREIF nor its Board express any opinion of the content presented herein. CBRE OUTLOOK Cap Rate Trends vs. Apartment Caps & 10-Year Treasury Irrational Exuberance Demographic Influence Rational Market Over Correction REIT Impact Back to Rational Market 14% 12% NC 10% AL IL 8% Apartment 10Y - T 6% 4% 2% 2017 2016 2015 2014 2013 2012 2011 2010 2009 2008 2007 2006 2005 2004 2003 2002 2001 2000 1999 1998 1997 0% Source: NIC MAP & CBRE Econometric Advisors 18 NCREIF | THE COMING OF AGE FOR SENIORS HOUSING | ZACH BOWYER, MAI This document was presented during the 2013 NCREIF Fall Conference. The author(s) take full responsibility for all content. This posting is for informational purposes only; neither NCREIF nor its Board express any opinion of the content presented herein. CBRE INSIGHT • Understand the property specific operations and understand the market; hire a local or regional operator with scale, experience and relationships in the local market and deeply vest them into the property’s underwritten success. • Understand where your property fits in the market; current property trend lines may not be telling the whole story. • Even the strongest market opportunities with the best market capitalizations will fall below expectations if the operator isn’t a good fit or fails to understand the asset strategy and market dynamic. • Capitalize the opportunity to age your resident base in place throughout their acuity progression. • Replacing senior living operators mid-stream is far more challenging and costly than the other four property types: office, industrial, retail, and multifamily. • Expect cap rate compression between AL and IL, and AL and Apts to continue. The increase in capital flow, operational and market understanding, and growth in product demand will continue to mitigate investors’ perceived risk when pricing this property type. 19 NCREIF | THE COMING OF AGE FOR SENIORS HOUSING | ZACH BOWYER, MAI This document was presented during the 2013 NCREIF Fall Conference. The author(s) take full responsibility for all content. This posting is for informational purposes only; neither NCREIF nor its Board express any opinion of the content presented herein. For more information regarding this presentation please contact: Zach Bowyer, MAI Managing Director & Seniors Housing Practice Leader T +1 617 912 6878 zach.bowyer@cbre.com www.cbre.com
