Mineral: Naturally occurring solid with a specific chemical
advertisement
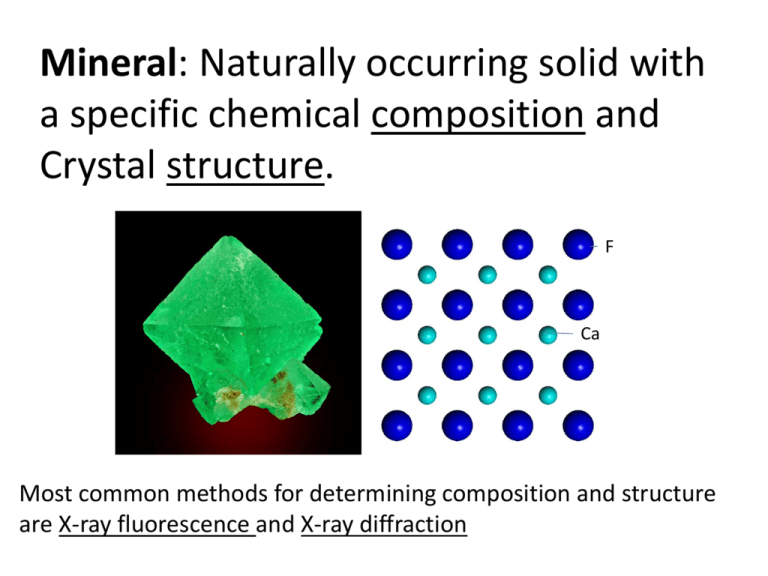
Mineral: Naturally occurring solid with a specific chemical composition and Crystal structure. F Ca Most common methods for determining composition and structure are X-ray fluorescence and X-ray diffraction X-ray fluorescence (aka: energy dispersive spectroscopy (EDS), EDAX, WDS, etc.) For elemental (chemical) analysis DE = 5994.2 – 6.766 = 5987.4 eV = hc = 1236.57 ev*nm E 5987.4 ev = 0.206 nm = 2 Å (X-ray) Scanning electron microscope (SEM) imaging X-ray fluorescence Electron diffraction X-ray Diffraction For crystal structure analysis and mineral identification - end V + end Standard laboratory X-ray source (tube) operates by X-ray fluorescence The introduction of phase differences produces a change in amplitude Differences in the length of the path traveled lead to differences in phase The waves will remain in phase if DD = ? = n where n = whole number (1,2,3… 1 Y X 1’ 3 3’ q A B X’ q Y’ q q d F q q G E sin Θ = opp/hyp FE = d sinΘ EG = d sinΘ FE + EG = d sinΘ + d sinΘ = 2d sinΘ n = 2d sinΘ Bragg equation Single crystal Diffraction Pattern = 2dsinΘ X-ray source Crystal Single crystal X-ray diffraction Diffraction data on CCD detector hkl h’’k’’l’’ h’k’l’ Diffraction spots (reciprocal lattice spots) have different positions and intensities In 3D The intensity, Ihkl of a diffraction peak is determined by what atoms are present and where on the atomic plane (i.e. electron density). It is related to a function called the structure factor Fhkl Ihkl ∝ │Fhkl │ 2 Structure Factor scattering Fhkl xyze 2i hx ky lz dV hkl 1 ( xyz) h k l Fhkl cos 2 (hx ky lz hkl ) V Goniometer Powder (many crystal) X-ray diffraction Point Detector Multi crystal (Powder) Diffraction Pattern X-Ray Powder Diffraction from a polycrystalline sample. Our goal is a deeper knowledge of the fundamental chemical, biological, and physical factors that govern the reactivity and cycling of contaminants in the environment. Such information is essential for the development of new (bio)remediation technologies and the remediation of high level waste (HLW) and contaminated facilities. #1 Speciation Synchrotron radiation based techniques provide unique capabilities to determine metal ion and organic speciation and to characterize complex inorganic and organic environmental solids in subsurface and waste materials. Lecture Outline ● General characteristics of synchrotrons and microprobe facilities ● Analytical methods available at synchrotron microprobe facilities, with examples from our research on apatite and other minerals. ● mXRF Surface structural controls on REE incorporation in apatite, fluorite and diamond ● mXANES Quantification of Eu oxidation states in apatite ● mEXAFS Crystal chemistry of U and Th in apatite ● mXRD and time-resolved XRD Phase transitions in apatite precursors Advanced Photon Source (APS) Argonne National Laboratory, Chicago, Illinois (Sector 13: GSE-CARS) SOLARIS POLISH SYNCHROTRON RADIATION SOURCE http://issrns2012.ifj.edu.pl/ NSLS NSLS2 Brookhaven National Laboratory, Upton, New York NSLS2 $912 million to design and build National Synchrotron Light Source (NSLS) Brookhaven National Laboratory, Upton, New York (Beamlines X26A & X27B) Booster ring LINAC hutch National Synchrotron Light Source X26A and X27B NSLS Experimental Hutch Beamline Synchrotron storage ring and bending magnets Sector 13 APS Insertion devices: Wiggelers and Undulators Beamline Beamline X-ray source spectral characteristics Synchrotron Radiation Characteristics High photon flux (increases sensitivity) Spectral distribution (white beam) Polarization (maximize of signal to noise) Pulsed time structure (time resolved experiments 10-15s range) Beam geometry (high spatial resolution) X-ray (or e-) Source lab synchrotron X-ray diffraction Analytical technique X-ray fluorescence X-ray Spectroscopy (new to us) Minimum detection limit Minimum Sample size Spatial resolution Time for data collection Monochromatic X-ray beam White X-ray beam 2-Crystal Monochrometer (by diffraction) NSLS X26A Experimental Hutch NSLS X26A Beamline Configuration KB Mirror-based hard X-ray microprobe • • • • Kirkpatrick-Baez Microfocusing Optics EDS Ge Array Detector Canberra WDS detector Bruker SMART 1500 CCD Area Detector Energy Range Category: •Monochromatic + White •3-30 keV energy range •Si(111) and Si(311) Channel-cut Monochromators Beam polarization – allows optimal signal to noise Two KB-Mirror Based X-Ray Microprobes Source Beam Size (µm) Flux @ 10 keV (ph/s) µXRF µXANES µEXAFS fCMT NSLS X26A Bending Magnet (2.8 GeV) 10 1 x 10⁹ 1 ppm 10-100 ppm 1000 ppm 1% 10-100 ppm APS 13-ID Undulator (7 GeV) 1 4 x 10¹¹ 100 ppb 1-10 ppm 100-1000 ppm 1-100 ppm Beam Line mXRF Micro-X-ray fluorescence Elemental analysis with ● low minimum detection ● high spatial resolution ● coupled with other analyses Synchrotron X-ray kicks our core electron from atoms in sample, Higher energy core electron fills empty electron level, and ejects an x-ray of fixed energy. • Peak energies element diagnostic • ~1ppm sensitivity in 30 pg particle (X26A NSLS) Energy Number of emitted photons X-ray fluorescence mapping SXRFMA Dy Optical photomicrograph 0.5 ppm 1.5 ppm 2.5 ppm Trace element mapping nonequivalent growth sectors in single crystal fluorite sections (area scans) (Bosze & Rakovan, 2002) Investigation of a single municipal waste fly ash particle absorption image XRF maps XRD patterns mXANES spectra (From Somogyi et al., 2006) mXRD Micro- X-ray Diffraction “Simultaneous” XRF/XAS/XRD and Time Resolved XRD Investigation of a single municipal waste fly ash particle absorption image XRF maps XRD patterns mXANES spectra (From Somogyi et al., 2006) apatite monetite brushite 2θ Time resolved studies of nucleation and phase transformations (Borkiewicz et al., in prep) X-ray absorption spectroscopy (XAS) XANES EXAFS X27 3-40 KeV Unfocused White 4-28 KeV Focused Monochromatic Fermi level EF=0 peE = hn - Ebinding t IO X-rays IT -mt IT = IOe IT Incident X-ray E 1/IT Energy - = ln(Io/I) can be collected from solids or liquids XANES EXAFS photoelectron can be described in terms of E, , f, k (Rakovan et al., 2002) EXAFS Theory k k Photoelectron scatters off of surrounding atoms and modulates the probability of absorbing the incident synchrotron photon: EXAFS Photoelectron absorbing atom R0 Scattered Photoelectron Fourier Transform of (k) • Similar to an atomic radial distribution function – – – – Distance Number Type Structural disorder Theoretically calculated values (we will use FEFF) Parameters often determined from a fit to data fi(k) effective scattering amplitude di(k) effective scattering phase shift (k) mean free path Ni degeneracy of path (CN) S02 Amplitude reduction factor (passive electron contribution) i2 mean squared displacement (DW) Rj path length mXANES Micro-X-ray Absorption Near Edge Structure Spectroscopy ● Oxidation state information for specific elements ● High spatial resolution ● Structural information in some cases Eu L3-edge XANES 4.00E+00 Eu3+ Intensity 3.00E+00 2.00E+00 1.00E+00 Eu2+ 0.00E+00 6.96E+03 6.97E+03 6.98E+03 6.99E+03 7.00E+03 -1.00E+00 Energy (eV) (Rakovan et al., 2001) U L3-edge XANES 2p3/2 6d t2g 2p3/2 6d eg (Rakovan et al., 2002) O3 ? 2.81 Å O1 O2 O1 2.40 Å O3 O2 O2 Ca2+ O2 O1 O1 O2 O1 U6+ 2.46 Å 2.06 Å O3 ? 2.06 Å O2 O1 ? Ca1 site (Rakovan et al., 2002)
