Sensory Lab Biology 5610 INTRODUCTION There are four primary
advertisement
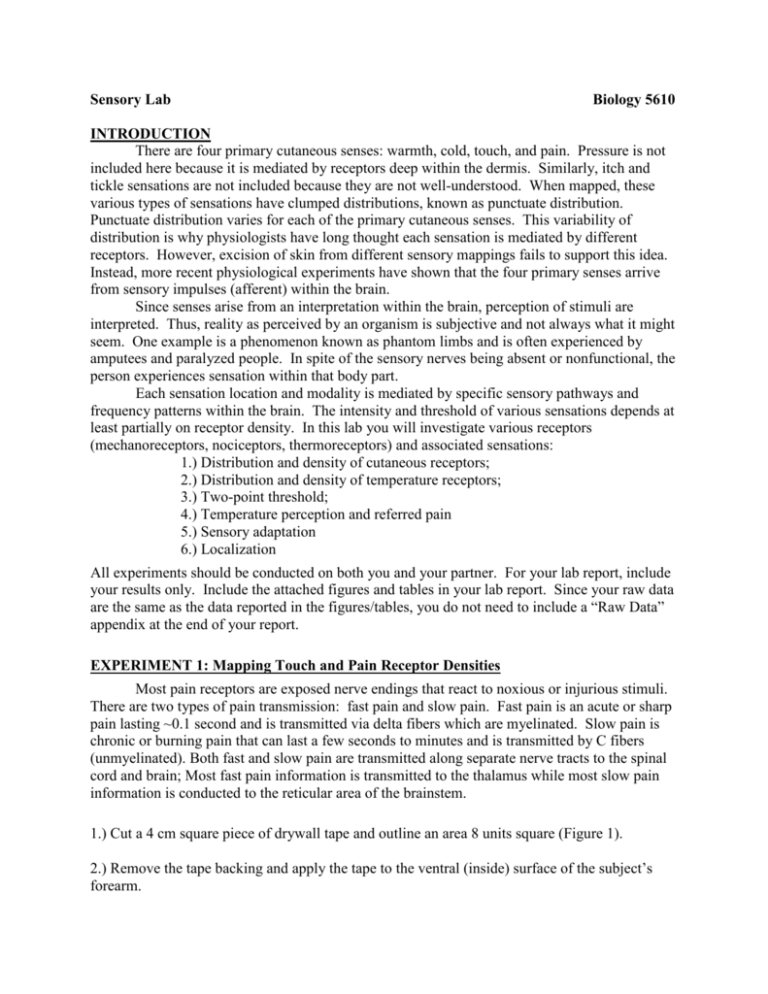
Sensory Lab Biology 5610 INTRODUCTION There are four primary cutaneous senses: warmth, cold, touch, and pain. Pressure is not included here because it is mediated by receptors deep within the dermis. Similarly, itch and tickle sensations are not included because they are not well-understood. When mapped, these various types of sensations have clumped distributions, known as punctuate distribution. Punctuate distribution varies for each of the primary cutaneous senses. This variability of distribution is why physiologists have long thought each sensation is mediated by different receptors. However, excision of skin from different sensory mappings fails to support this idea. Instead, more recent physiological experiments have shown that the four primary senses arrive from sensory impulses (afferent) within the brain. Since senses arise from an interpretation within the brain, perception of stimuli are interpreted. Thus, reality as perceived by an organism is subjective and not always what it might seem. One example is a phenomenon known as phantom limbs and is often experienced by amputees and paralyzed people. In spite of the sensory nerves being absent or nonfunctional, the person experiences sensation within that body part. Each sensation location and modality is mediated by specific sensory pathways and frequency patterns within the brain. The intensity and threshold of various sensations depends at least partially on receptor density. In this lab you will investigate various receptors (mechanoreceptors, nociceptors, thermoreceptors) and associated sensations: 1.) Distribution and density of cutaneous receptors; 2.) Distribution and density of temperature receptors; 3.) Two-point threshold; 4.) Temperature perception and referred pain 5.) Sensory adaptation 6.) Localization All experiments should be conducted on both you and your partner. For your lab report, include your results only. Include the attached figures and tables in your lab report. Since your raw data are the same as the data reported in the figures/tables, you do not need to include a “Raw Data” appendix at the end of your report. EXPERIMENT 1: Mapping Touch and Pain Receptor Densities Most pain receptors are exposed nerve endings that react to noxious or injurious stimuli. There are two types of pain transmission: fast pain and slow pain. Fast pain is an acute or sharp pain lasting ~0.1 second and is transmitted via delta fibers which are myelinated. Slow pain is chronic or burning pain that can last a few seconds to minutes and is transmitted by C fibers (unmyelinated). Both fast and slow pain are transmitted along separate nerve tracts to the spinal cord and brain; Most fast pain information is transmitted to the thalamus while most slow pain information is conducted to the reticular area of the brainstem. 1.) Cut a 4 cm square piece of drywall tape and outline an area 8 units square (Figure 1). 2.) Remove the tape backing and apply the tape to the ventral (inside) surface of the subject’s forearm. 3.) Allow the subject to touch the area within the square with a pin so she/he can learn to distinguish between pain and touch receptors. 4.) Within each of the 64 grid spaces outlined, carefully touch the subject’s forearm with a pin. Indicate on Figure 1 whether the subject experienced pain or touch for each grid space. Only test each grid space once. 5.) Do NOT remove the drywall tape; it will be used in the next experiment. QUESTIONS 1.) Describe the density and distribution of sensation for each stimulus. 2.) Discuss any implications this has for an organism. 3.) What does sensation mapping indicate (think physiology)? 5.) Discuss the term “homunculus” as it pertains to sensory neurons. EXPERIMENT 2: Mapping Temperature Receptor Densities and Distribution Ion channels sensitive to heat (n=4) and cold (n=2) have been discovered within the past century. These ion channels facilitate the transmission of sensory neurons to the brain. However, it was not known until recently how only 4 heat channels and 2 cold channels could discriminate such a variety of temperatures and subtle changes in temperature. It was found that channel subunits can co-assemble to form new functioning channels. This re-assembling enables up to 256 heat sensitive channels (4^4) and explains the thermosensitivity seen in humans and other complex organisms. 1.) Repeat step 4 from Experiment 1 using a clod blunt probe instead of a pin. 2.) Repeat the above exercise using a warm blunt probe and record the observations in Figure 2. QUESTIONS 1.) Measure the dimensions of the individual grids. Compare this dimension with the estimated area that one cold receptor spans (~1.5mm). 2.) If a subject reported the sensation of cold when two adjacent grid squares are stimulated, how many cold receptors are likely involved? What about three adjacent grid squares? 3.) Report the total number of cold/heat receptors in the 8x8 grid. 4.) Report the density of cold/heat receptors in the 8x8 grid. 5.) What proportion of grid squares was sensitive to cold/heat? Were these respective areas also sensitive to pain or touch? 6.) What is the implication of your results the above question? EXPERIMENT 3: Two-Point Discrimination and Distribution Touch receptors are distributed unevenly across the body. Some regions have dense distribution while others have sparse distribution. Two-point discrimination is a simple way to determine densities across various areas of the body. 1.) Beginning with calipers set to a distance of 80mm, and the subject’s eyes closed, touch the dorsal (back) side of the subject’s hand and ask her/him to report if one or two points are sensed. 2.) Repeat this procedure while reducing the caliper settings by 10mm increments until only one stimulus is perceived. While doing so, touch your partner’s hand with only one caliper tip at random intervals. This will prevent your subject from guessing what stimulus will be applied. 3.) Record the distance at which only one stimulus is perceived (Table 1). This is known as a critical point. 4.) Continue this experiment for the other parts of the body: palm of hand, index fingertip, forearm (non-hairy, ventral surface), upper arm (outer surface), shin, back of neck. Note that some of the more sensitive areas of the body may display a very small critical point. In such instances, use smaller spacing intervals when decreasing the spread of the calipers, such as 1mm. QUESTIONS 1.) Discuss how two-point discrimination varies with region. 2.) Suggest how two-point discrimination might be an adaptation for the body parts you tested. EXPERIMENT 4: Temperature Perception and Referred Pain When one hand is placed in warm water and another in cold water, the strength of stimulation gradually diminishes until both types of temperature receptors have adapted to their new environment. If the two hands are then placed in water at an intermediate temperature, the hands feel different. The baseline of the receptors has obviously changed. The perception of temperature is there for not absolute but relative to the baseline previously established by sensory adaptation. Referred pain is the phenomenon of perceiving pain in one area of the body when another area is actually receiving the painful stimulus. This occurs when there is convergence of sensory (afferent) fibers onto the dorsal horn relay cells in the spinal cord. We say that the pain is referred to the other area. 1.) Instruct the subject to place his/her hand in each of these beakers of varying conditions for 10 seconds each: hot, cold, tepid. The subject should place his/her hand in each of the varying sequences of the 3 beakers to observe the relative change in perceived temperatures (Table 2a). Between each sequence, allow ~1 minute wait until starting another sequence (or until recovery). 2.) Instruct the subject to place his/her elbow in the ice water beaker for 2 minutes. Record the location and type of sensation at 0, 60, and 120 seconds (Table 2b). QUESTIONS 1.) Discuss the change in sensation perceived during the 3 beaker test. 2.) Do your thermal sensations always indicate the absolute temperature of an object? Why? 3.) Discuss the location of sensation perceived during the 2 minute test. 3.) Does your thermal sensory system show adaptation? Describe this in terms of the stimulus to the receptors. EXPERIMENT 5: Adaptation Many sense receptors respond strongly to acute changes in the environment and cease responding when the stimuli become constant. This phenomenon is known as sensory adaptation. For example, our sense of smell quickly adapts to the odors of the laboratory, while our touch receptors soon cease to inform us of our clothing until these stimuli change. 1.) Place a cork on your partner’s forearm and measure the time required for the initial sensation from the pressure of the cork to abate (Table 3). 2.) Repeat an additional 2 times and calculate the average time. QUESTIONS 1.) Is there much variability in recognition time among trials? Explain. 2.) How does adaptation correlated with receptor density, if at all? 2.) What are some evolutionary advantages of sensory adaptation? Disadvantages? EXPERIMENT 6: Tactile Localization Tactile localization is the perception of a stimulus at a specific location on the body. Precision of locating the stimulus origin is associated with stimulus intensity as well as receptor density at the stimulus location. Since receptors are not distributed evenly across the dermis, different parts of the body have different capacities to locate the stimulus. 1.) Using a pen that will leave a mark on your subject’s palm (such as a permanent marker), touch a point on the subject’s palm. Use the non-dominant arm as the marking arm. Have the subject close his/her eyes during this test. 2.) Give the pen to the subject and have her/him attempt to touch the spot where the initial touch was made, using his/her dominant arm. Make sure his/her eyes remain closed. 3.) Measure and record the distance between the two marks (Table 4). 4.) Repeat this test 2 more times for each body region listed in Table 4, marking in a different area each time. Calculate the average distance for each body region. 5.) Create a figure that sequentially shows the distance error in each of the 5 trials for each body region. Include data for each of the 3 body regions on one figure. QUESTIONS 1.) Does the error of localization vary with the region? How? Discuss why. 2.) Is the ability to localize in a region related to the density of sensitive spots in that region? Why or Why not? 3.) Does learning or experience modify the accuracy of localization? 4.) Are any of the tests performed during this lab viable technique that can be used in? How and Why? EXPERIMENT 1 Figure 1: Touch Receptors. Mark pain receptors with a filled circle and touch receptors with an open circle. EXPERIMENT 2 Figure 2: Temperature Receptors. Mark heat receptors with an "H," cold receptors with a "C," and touch receptors with an "O." EXPERIMENT 3 Table 1: Two-Point Discrimination Body Area Back of Hand Distance (mm) Palm of Same Hand Index Fingertip Forearm Upper Arm Shin Back of Neck EXPERIMENT 4 Table 2a: Hand in the Beakers Treatment Sequence Tepid - Hot - Cold Tepid - Cold - Hot Hot - Tepid - Cold Hot - Cold - Tepid Cold - Tepid - Hot Cold - Hot - Cold Table 2b: Elbow in Ice Water Time Location 0s 60s 120s EXPERIMENT 5 Table 3: Cork Recognition Trial Time (s) 1 2 3 Mean Sensation Sensation EXPERIMENT 6 Table 4: Caliper Recognition Palm of Hand Error (mm) Trial 1 2 3 Mean Fingertip Error (mm) Inner Forearm Error (mm)
