Wolseley Plc
advertisement

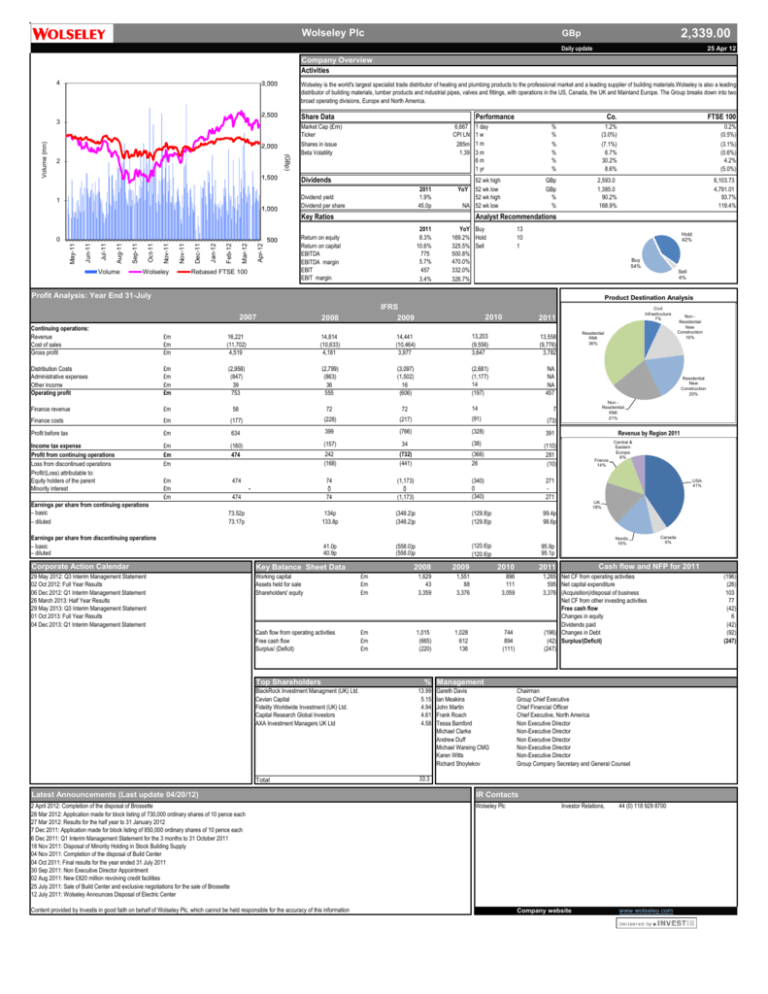
Wolseley Plc 2,339.00 GBp Daily update 25 Apr 12 Company Overview Activities 4 Wolseley is the world's largest specialist trade distributor of heating and plumbing products to the professional market and a leading supplier of building materials.Wolseley is also a leading distributor of building materials, lumber products and industrial pipes, valves and fittings, with operations in the US, Canada, the UK and Mainland Europe. The Group breaks down into two broad operating divisions, Europe and North America. Share Data (GBp) Volume (mn) 3 2 Performance Market Cap (£m) Ticker Shares in issue Beta Volatility 6,667 CPI LN 285m 1.39 Dividends 2011 1.9% 45.0p Dividend yield Dividend per share 1 52 wk high 52 wk low 52 wk high NA 52 wk low YoY Key Ratios Volume Wolseley Apr-12 Apr Mar-12 Mar Feb-12 Feb Jan-12 Jan Dec-11 Dec Nov-11 Nov Oct-11 Oct Nov-11 Nov Sep Sep-11 Jul-11 Jul Aug Aug-11 Jun-11 Jun May-11 May 0 Rebased FTSE 100 1 day 1w 1m 3m 6m 1 yr Co. FTSE 100 % % % % % % 1.2% (3.0%) (7.1%) 6.7% 30.2% 8.6% 8.4 0.2% (0.5%) (3.1%) (0.6%) 4.2% (5.0%) GBp GBp % % 2,593.0 1,385.0 90.2% 168.9% 6,103.73 4,791.01 93.7% 119.4% Analyst Recommendations 2011 8.3% 10.6% 775 5.7% 457 3.4% Return on equity Return on capital EBITDA EBITDA margin EBIT EBIT margin YoY Buy 169.2% Hold 325.5% Sell 500.8% 470.0% 332.0% 326.7% 13 10 1 Hold 42% Buy 54% Sell 4% Profit Analysis: Year End 31-July Product Destination Analysis 2007 IFRS 2009 2008 2010 Continuing operations: Revenue Cost of sales Gross profit £m £m £m 16,221 (11,702) 4,519 14,814 (10,633) 4,181 14,441 (10,464) 3,977 13,203 (9,556) 3,647 13,558 (9,776) 3,782 Distribution Costs Administrative expenses Other income Operating profit £m £m £m £m (2,958) (847) 39 753 (2,799) (863) 36 555 (3,097) (1,502) 16 (606) (2,681) (1,177) 14 (197) NA NA NA 457 Finance revenue £m 58 72 72 14 (73) Finance costs £m (177) (228) (217) Profit before tax £m 634 399 (766) (328) 391 Income tax expense Profit from continuing operations Loss from discontinued operations Profit/(Loss) attributable to: Equity holders of the parent Minority interest £m £m £m (160) 474 (157) 34 (38) 242 (168) (732) (441) (366) 26 (110) 281 (10) £m £m £m 474 474 74 0 74 (1,173) 0 (1,173) (340) 0 (340) 271 271 73.52p 73.17p 134p 133.8p (348.2)p (348.2)p (129.8)p (129.8)p 99.4p 98.6p 41.0p 40.9p (558.0)p (558.0)p (120.6)p (120.6)p 95.9p 95.1p Earnings per share from continuing operations – basic – diluted Residential RMI 36% Non Residential New Construction 16% Residential New Construction 20% Non Residential RMI 21% 7 (91) - Civil Infrastructure 7% 2011 Revenue by Region 2011 France 14% Central & Eastern Europe 6% USA 41% UK 18% Earnings per share from discontinuing operations – basic – diluted Corporate Action Calendar Key Balance Sheet Data 2008 2009 2010 29 May 2012: Q3 Interim Management Statement 02 Oct 2012: Full Year Results 06 Dec 2012: Q1 Interim Management Statement 26 March 2013: Half Year Results 29 May 2013: Q3 Interim Management Statement 01 Oct 2013: Full Year Results 04 Dec 2013: Q1 Interim Management Statement Working capital Assets held for sale Shareholders' equity £m £m £m 1,629 43 3,359 1,551 88 3,376 896 111 3,059 Cash flow from operating activities Free cash flow Surplus/ (Deficit) £m £m £m 1,015 (665) (220) 1,028 612 136 744 894 (111) Top Shareholders Canada 6% Cash flow and NFP for 2011 2011 1,265 Net CF from operating activities 595 Net capital expenditure 3,376 (Acquisition)/disposal of business Net CF from other investing activities Free cash flow Changes in equity Dividends paid (196) Changes in Debt (42) Surplus/(Deficit) (247) % Management BlackRock Investment Managment (UK) Ltd. Cevian Capital Fidelity Worldwide Investment (UK) Ltd. Capital Research Global Investors AXA Investment Managers UK Ltd 13.99 5.15 4.94 4.61 4.58 Total 33.3 Gareth Davis Ian Meakins John Martin Frank Roach Tessa Bamford Michael Clarke Andrew Duff Michael Wareing CMG Karen Witts Richard Shoylekov Chairman Group Chief Executive Chief Financial Officer Chief Executive, North America Non Executive Director Non-Executive Director Non Executive Director Non-Executive Director Non-Executive Director Group Company Secretary and General Counsel Latest Announcements (Last update 04/20/12) IR Contacts 2 April 2012: Completion of the disposal of Brossette 28 Mar 2012: Application made for block listing of 730,000 ordinary shares of 10 pence each 27 Mar 2012: Results for the half year to 31 January 2012 7 Dec 2011: Application made for block listing of 850,000 ordinary shares of 10 pence each 6 Dec 2011: Q1 Interim Management Statement for the 3 months to 31 October 2011 18 Nov 2011: Disposal of Minority Holding in Stock Building Supply 04 Nov 2011: Completion of the disposal of Build Center 04 Oct 2011: Final results for the year ended 31 July 2011 30 Sep 2011: Non Executive Director Appointment 02 Aug 2011: New £820 million revolving credit facilities 25 July 2011: Sale of Build Center and exclusive negotiations for the sale of Brossette 12 July 2011: Wolseley Announces Disposal of Electric Center Wolseley Plc Content provided by Investis in good faith on behalf of Wolseley Plc, which cannot be held responsible for the accuracy of this information Nordic 16% Investor Relations, Company website 44 (0) 118 929 8700 www.wolseley.com (196) (26) 103 77 (42) 6 (42) (92) (247)


