Enzymes and Cellular Regulation
What are the factors that regulate the rate at which enzymes catalyze reactions?
Why?
Digestive enzymes are protein-based biological catalysts that play important roles in our lives. They help
remove stains from our shirts, turn milk into cheese, and are responsible for turning our dinner into useable fuel for our bodies. Enzymes however do not work well universally. Some are meant to work at high
temperatures, others at low temperatures. They may work best in acidic conditions or neutral conditions.
In this activity we will look at the optimal conditions for two different enzymes. The digestive enzyme
lipase is made in the pancreas and breaks down lipids in the small intestine, while pepsin breaks down
proteins in the stomach.
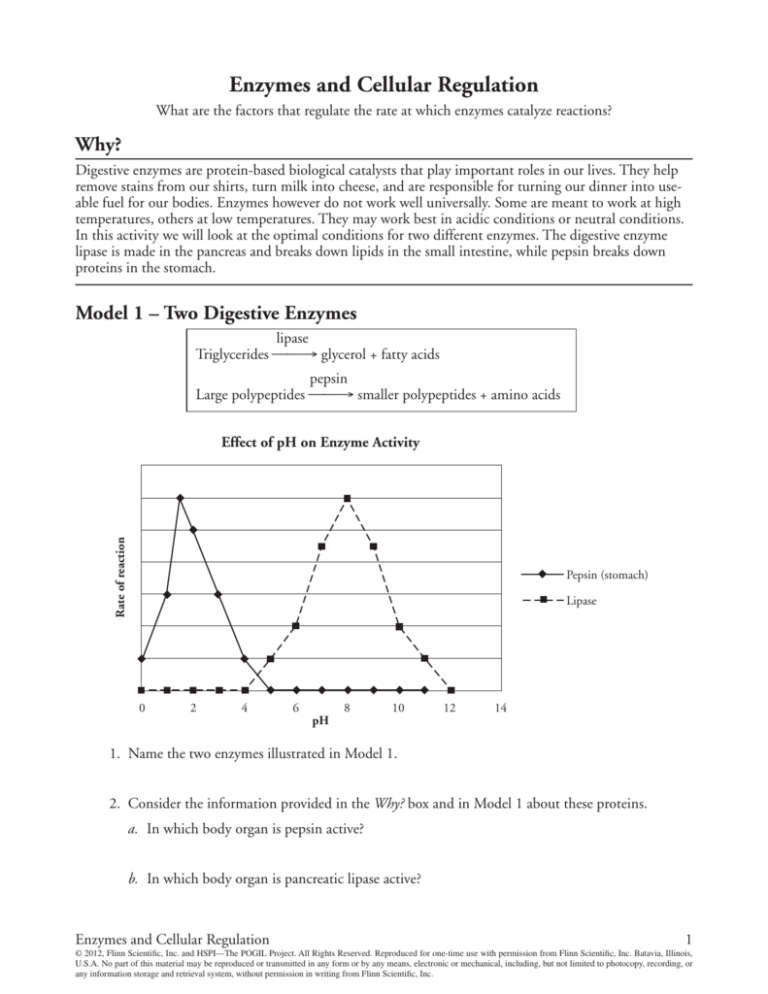
Model 1 – Two Digestive Enzymes
lipase
Triglycerides ⎯⎯→ glycerol + fatty acids
pepsin
Large polypeptides ⎯⎯→ smaller polypeptides + amino acids
Rate of reaction
Effect of pH on Enzyme Activity
Pepsin (stomach)
Lipase
0
2
4
6
pH
8
10
12
14
1. Name the two enzymes illustrated in Model 1.
2. Consider the information provided in the Why? box and in Model 1 about these proteins.
a. In which body organ is pepsin active?
b. In which body organ is pancreatic lipase active?
Enzymes and Cellular Regulation
1
© 2012, Flinn Scientific, Inc. and HSPI—The POGIL Project. All Rights Reserved. Reproduced for one-time use with permission from Flinn Scientific, Inc. Batavia, Illinois,
U.S.A. No part of this material may be reproduced or transmitted in any form or by any means, electronic or mechanical, including, but not limited to photocopy, recording, or
any information storage and retrieval system, without permission in writing from Flinn Scientific, Inc.
3. For each enzyme in Model 1, circle the pH that best represents the environment in which the
enzyme is most active.
Pepsin
1.5
8
10.4
Lipase
1.5
8
10.4
4. Compare the rate of the pepsin-catalyzed reaction at pH 1.5 with the rate of the lipase-catalyzed
reaction at pH 1.5.
5. Compare the rate of the pepsin-catalyzed reaction at pH 8 with the rate of the lipase-catalyzed
reaction at pH 8.
6. Using your knowledge of protein structure, explain in detail the effect of exposing an enzyme to
a pH outside of its optimal range. Include the effect on both enzyme structure and function.
7. At what pH values is lipase likely to be denatured? Justify your answer.
8. At what pH values is pepsin likely to be denatured? Justify your answer.
9. In addition to being produced in the pancreas, lipase is also produced in the stomach. Is the
structure of pancreatic lipase the same as gastric (produced in the stomach) lipase? Justify your
reasoning.
10. Add a line to the graph in Model 1 that shows a prediction for gastric lipase activity.
11. Antacids work by neutralizing acids, bringing the pH of the stomach to a range of 6–7. What is
the effect of taking an antacid on a person’s ability to digest proteins?
2POGIL™ Activities for AP* Biology
© 2012, Flinn Scientific, Inc. and HSPI—The POGIL Project. All Rights Reserved. Reproduced for one-time use with permission from Flinn Scientific, Inc. Batavia, Illinois,
U.S.A. No part of this material may be reproduced or transmitted in any form or by any means, electronic or mechanical, including, but not limited to photocopy, recording, or
any information storage and retrieval system, without permission in writing from Flinn Scientific, Inc.
Model 2 – Amylase Rate of Reaction
B
Rate of reaction
Rate of reaction
A
0
20
40
60
Temperature, °C
80
100
Enzyme concentration
(Substrate concentration always in excess)
Rate of reaction
C
Substrate concentration
(Enzyme concentration constant)
12. Amylase is an enzyme that catalyzes the digestion of carbohydrates. The graphs in Model 2 provide data on several factors that affect the function of amylase in the body.
a. The relationship of which two variables is illustrated in graph A of Model 2?
b. The relationship of which two variables is illustrated in graph B or Model 2?
c. The relationship of which two variables is illustrated in graph C or Model 2?
13. Refer to Model 2.
a. What is the optimum temperature for amylase?
b. What is the biological significance of the temperature at which the amylase-catalyzed reaction
is fastest?
Enzymes and Cellular Regulation
3
© 2012, Flinn Scientific, Inc. and HSPI—The POGIL Project. All Rights Reserved. Reproduced for one-time use with permission from Flinn Scientific, Inc. Batavia, Illinois,
U.S.A. No part of this material may be reproduced or transmitted in any form or by any means, electronic or mechanical, including, but not limited to photocopy, recording, or
any information storage and retrieval system, without permission in writing from Flinn Scientific, Inc.
14. Predict what causes a decrease in enzyme activity at temperatures above 37 °C.
15. A young child runs a fever of 40 °C for 24 hours. Explain what effect this may have on his
digestion.
16. Consider the data in graph B of Model 2.
a. Describe the relationship between enzyme concentration and reaction rate.
b. Propose an explanation for this relationship.
17. Consider the data in graph C of Model 2.
a. What is the relationship between substrate concentration and the reaction rate?
b. Propose an explanation for why a maximum reaction rate is reached in graph C.
18. As a group, develop an analogy for the function of an enzyme that will explain the concentration
graphs in Model 2 (graphs B and C).
19. Would the reaction rate on graph B of Model 2 ever reach a maximum level? Justify your answer.
4POGIL™ Activities for AP* Biology
© 2012, Flinn Scientific, Inc. and HSPI—The POGIL Project. All Rights Reserved. Reproduced for one-time use with permission from Flinn Scientific, Inc. Batavia, Illinois,
U.S.A. No part of this material may be reproduced or transmitted in any form or by any means, electronic or mechanical, including, but not limited to photocopy, recording, or
any information storage and retrieval system, without permission in writing from Flinn Scientific, Inc.
Extension Questions
20. Thermophilic bacteria, such as Thermus aquaticus, live in hot springs where the temperature is
greater then 70 °C. Draw a graph similar to graph A in Model 2 representing the optimal temperature of T. aquaticus.
21. DNA polymerase from T. aquaticus (Taq) is used in PCR (polymerase chain reaction). PCR is a
technique where millions of copies of DNA can be made from one original copy. In this method,
the target DNA molecule is subjected to temperatures over 95 °C to make the double-stranded
DNA separate. The temperature is then lowered slightly to allow primers to anneal before the
Taq polymerase catalyzes the reactions to incorporate new nucleotides into the complementary
strands. The cycle is then repeated over and over until there are millions of copies of the target
DNA.
a. Predict why this bacterial polymerase is used instead of a human polymerase.
b. What would happen if you used a human polymerase in a series of PCR reactions?
Read This!
The rate of an enzyme-catalyzed reaction can also be affected by the presence of other molecules that can
bind to the enzyme, changing its shape. In some reactions a coenzyme is necessary. This molecule binds
to the protein strands of the enzyme, changing its shape so that is ready to receive the substrate molecule.
Without the coenzyme, the enzyme would not be able to attach to the substrate. Other molecules can
reduce the rate of reaction for enzymes by binding to the protein and either blocking the spot where the
substrate will bind or by making the enzyme’s shape incompatible with the substrate. These molecules are
called inhibitors.
22. Sketch a graph that shows the relationship between the rate of an enzyme reaction and the
concentration of coenzyme necessary for the enzyme to function properly.
23. Add a line to graph C of Model 2 that shows the rate of an enzyme reaction in the presence of
inhibitor molecules.
Enzymes and Cellular Regulation
5
© 2012, Flinn Scientific, Inc. and HSPI—The POGIL Project. All Rights Reserved. Reproduced for one-time use with permission from Flinn Scientific, Inc. Batavia, Illinois,
U.S.A. No part of this material may be reproduced or transmitted in any form or by any means, electronic or mechanical, including, but not limited to photocopy, recording, or
any information storage and retrieval system, without permission in writing from Flinn Scientific, Inc.

