GLYCOLYSIS GLUCONEOGENESIS
advertisement
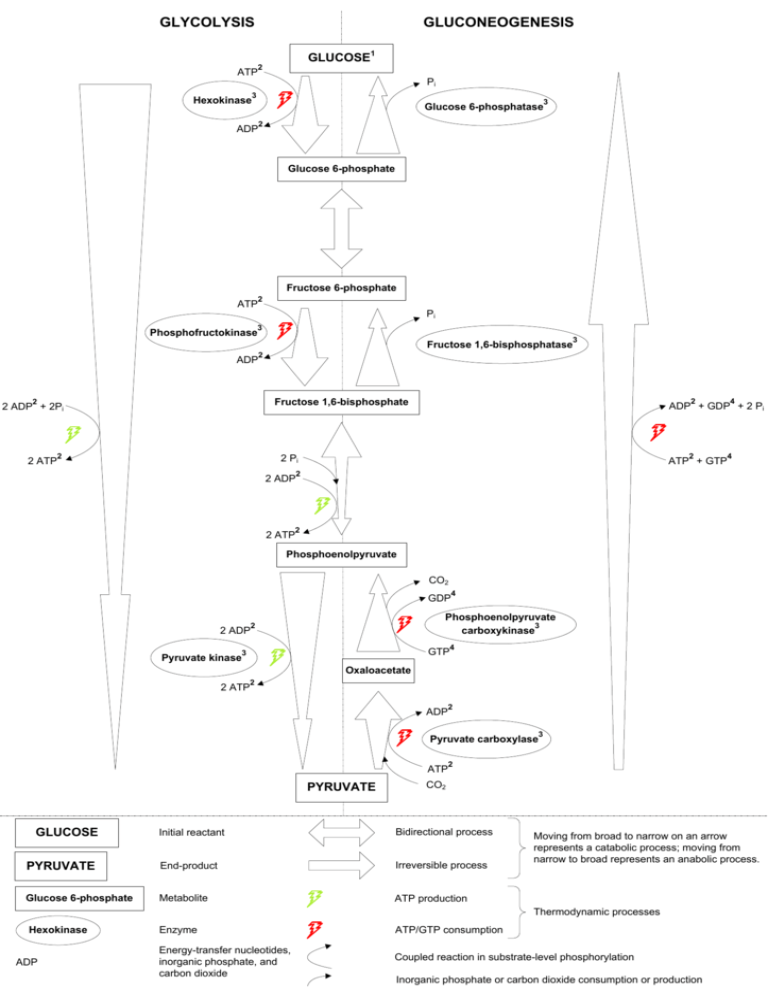
GLYCOLYSIS GLUCONEOGENESIS GLUCOSE1 ATP 2 Pi 3 Hexokinase Glucose 6-phosphatase 3 2 ADP Glucose 6-phosphate Fructose 6-phosphate ATP 2 Pi Phosphofructokinase 3 3 Fructose 1,6-bisphosphatase 2 ADP Fructose 1,6-bisphosphate 2 2 ADP + 2Pi 2 2 2 2 Pi 2 ATP 2 ADP 2 ATP 4 ADP + GDP + 2 Pi ATP + GTP 4 2 2 Phosphoenolpyruvate CO2 GDP 4 Phosphoenolpyruvate 3 carboxykinase 2 2 ADP GTP 3 Pyruvate kinase 4 Oxaloacetate 2 ATP 2 2 ADP 3 Pyruvate carboxylase 2 ATP PYRUVATE GLUCOSE CO2 Initial reactant Bidirectional process PYRUVATE End-product Irreversible process Glucose 6-phosphate Metabolite ATP production Moving from broad to narrow on an arrow represents a catabolic process; moving from narrow to broad represents an anabolic process. Thermodynamic processes Hexokinase ADP Enzyme ATP/GTP consumption Energy-transfer nucleotides, inorganic phosphate, and carbon dioxide Coupled reaction in substrate-level phosphorylation Inorganic phosphate or carbon dioxide consumption or production Links to Macromolecule Map: The preceding concept map, which illustrates glycolysis and gluconeogenesis, shows several components that relate to elements of the macromolecule concept map. These components are marked by numerical superscripts in the glycolysis and gluconeogenesis map. Their links to the macromolecule map are described below. In the descriptions, terms that appear in one or both concept maps are shown in boldface. 1 2 3 4 Glucose is a hexose monosaccharide. ATP and ADP are nucleotides. Both contain the pentose adenine. All species depicted as ellipses in the concept map are enzymes. Enzymes are proteins that catalyze chemical reactions. GTP and GDP are nucleotides. Both contain the pentose guanine.
