3,517,688.43 Beginning Cash Balance 12,379,022.21 Revenues
advertisement
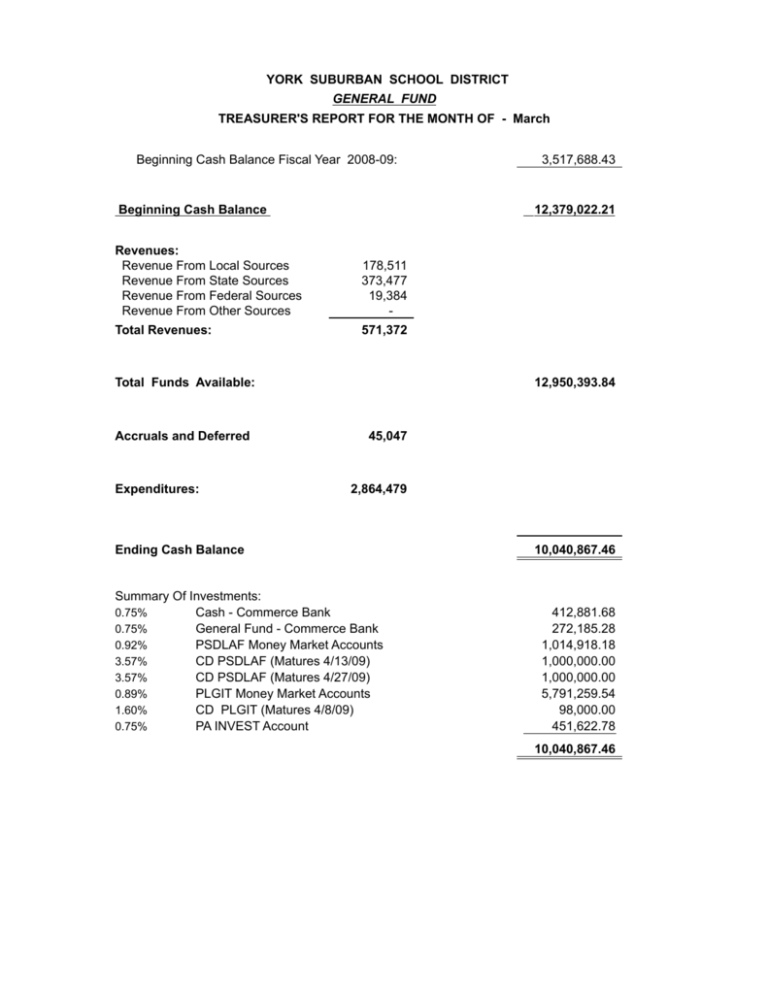
YORK SUBURBAN SCHOOL DISTRICT GENERAL FUND TREASURER'S REPORT FOR THE MONTH OF - March Beginning Cash Balance Fiscal Year 2008-09: Beginning Cash Balance 12,379,022.21 Revenues: Revenue From Local Sources Revenue From State Sources Revenue From Federal Sources Revenue From Other Sources 178,511 373,477 19,384 - Total Revenues: 571,372 Total Funds Available: Accruals and Deferred Expenditures: 3,517,688.43 12,950,393.84 45,047 2,864,479 Ending Cash Balance Summary Of Investments: 0.75% Cash - Commerce Bank 0.75% General Fund - Commerce Bank 0.92% PSDLAF Money Market Accounts 3.57% CD PSDLAF (Matures 4/13/09) 3.57% CD PSDLAF (Matures 4/27/09) 0.89% PLGIT Money Market Accounts 1.60% CD PLGIT (Matures 4/8/09) 0.75% PA INVEST Account 10,040,867.46 412,881.68 272,185.28 1,014,918.18 1,000,000.00 1,000,000.00 5,791,259.54 98,000.00 451,622.78 10,040,867.46 YORK SUBURBAN SCHOOL DISTRICT GENERAL FUND SUMMARY OF OPERATIONS - March 2008 Revenue From Local Sources: Real Estate Taxes Interim Real Estate Taxes Earned Income Taxes Real Estate Transfer Taxes Delinquent Taxes Interest on Investments Tuitions Other Local Revenue Total From Local Sources: March Actual Projected YEAR TO DATE Actual Projected % Received To Budget 20,424 19,314 66,765 41,489 19,464 11,055 1,283 18,701 78,094 43,841 56,307 13,824 114,441 31,058,037 87,095 1,945,812 322,892 370,943 259,377 142,606 290,289 31,798,304 213,108 1,674,407 522,269 443,468 461,056 131,166 305,613 99.74% 34.84% 80.07% 48.92% 67.44% 45.91% 83.89% 58.22% 178,511 326,491 34,477,051 35,549,391 95.08% 164,305 64,283 140,479 4,410 130,678 32,863 36,084 173,607 57,482 699,266 822,121 175,912 530,852 144,754 963,115 759,644 786,087 162,235 618,099 514,124 345,963 43.03% 74.33% 62.83% 64.08% 18.74% 69.68% 373,477 430,714 3,336,020 3,186,152 55.66% 19,384 24,031 120,717 163,605 66.42% - - Revenue From State Sources Basic Subsidy Special Education Subsidy Transportation Reimbursement Social Security Reimbursement Retirement Reimbursement Other State Subsidies Total From State Sources: Revenue From Federal Sources Revenue From Other Sources Total All Revenue: Expenses By Category: 1000 - Instruction 2000 - Support Services 571,372 781,236 March Actual Projected 37,933,788 - 38,899,148 YEAR TO DATE Actual Projected 0.00% 89.39% % Expended To Budget 1,821,180 2,190,779 18,274,601 17,934,647 67.97% 934,732 899,671 7,563,898 7,747,554 69.90% 3000 - Non-Instructional Services 67,222 50,626 359,301 314,502 81.91% 5000 - Debt Service 41,345 8,466 3,472,968 3,903,294 80.93% 2,864,479 3,149,542 29,670,768 29,899,997 69.92% Total All Expenditures: 2007-2008 Accruals and Deferrals 1,791,061.48
