Defining Energy Access for the World's Poor
advertisement
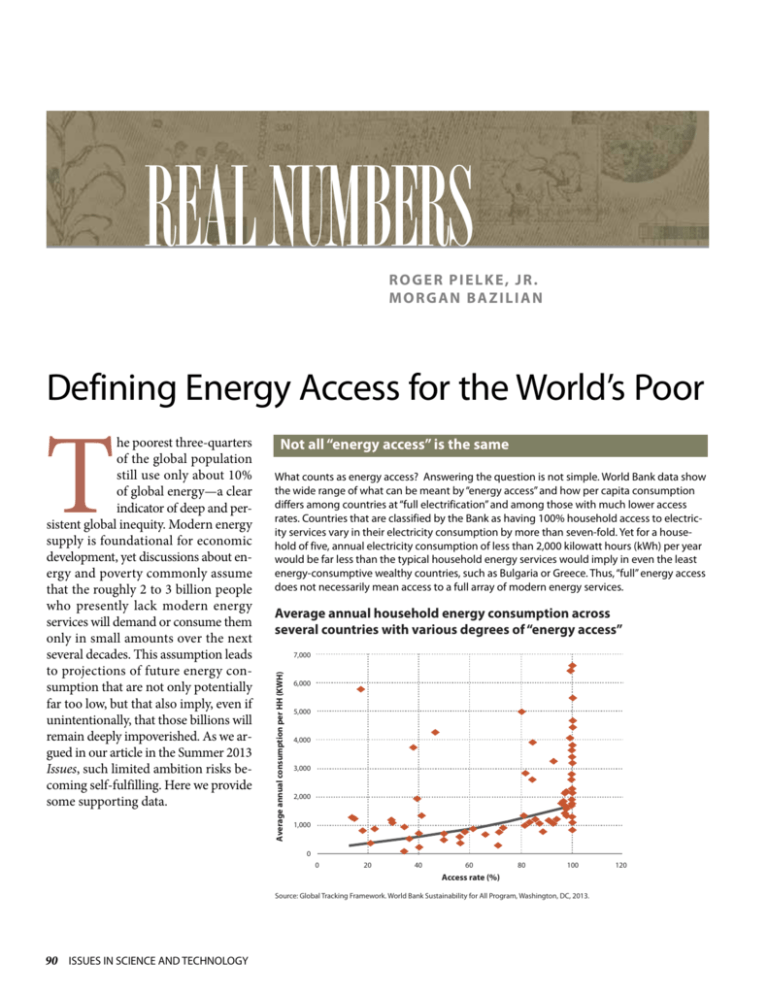
REAL NUMBERS ROGER PIELKE, JR. MORGAN BAZILIAN Defining Energy Access for the World’s Poor Not all “energy access” is the same What counts as energy access? Answering the question is not simple. World Bank data show the wide range of what can be meant by “energy access” and how per capita consumption differs among countries at “full electrification” and among those with much lower access rates. Countries that are classified by the Bank as having 100% household access to electricity services vary in their electricity consumption by more than seven-fold. Yet for a household of five, annual electricity consumption of less than 2,000 kilowatt hours (kWh) per year would be far less than the typical household energy services would imply in even the least energy-consumptive wealthy countries, such as Bulgaria or Greece. Thus, “full” energy access does not necessarily mean access to a full array of modern energy services. Average annual household energy consumption across several countries with various degrees of “energy access” 7,000 Average annual consumption per HH (KWH) T he poorest three-quarters of the global population still use only about 10% of global energy—a clear indicator of deep and persistent global inequity. Modern energy supply is foundational for economic development, yet discussions about energy and poverty commonly assume that the roughly 2 to 3 billion people who presently lack modern energy services will demand or consume them only in small amounts over the next several decades. This assumption leads to projections of future energy consumption that are not only potentially far too low, but that also imply, even if unintentionally, that those billions will remain deeply impoverished. As we argued in our article in the Summer 2013 Issues, such limited ambition risks becoming self-fulfilling. Here we provide some supporting data. 6,000 5,000 4,000 3,000 2,000 1,000 0 0 20 40 60 80 100 Access rate (%) Source: Global Tracking Framework. World Bank Sustainability for All Program, Washington, DC, 2013. 90 ISSUES IN SCIENCE AND TECHNOLOGY 120 REAL NUMBERS Better to be Bulgarian This figure provides some insight into how modern levels of energy access compare to proposed development benchmarks. The numbers for the United States, Germany, and Bulgaria provide a sense of the range of electricity consumption levels enjoyed by nations with “modern” economies. In contrast, the International Energy Agency’s (IEA) World Energy Outlook defines an “initial threshold” for energy access to be 250 kWh per year for rural households and 500 kWh per year for urban households, assuming 5 people per household. This equates to 50-100 kWh/year per person, or about 0.5% of the electricity consumed by the average American or Swede, and 1.7% of the average Bulgarian. For a sense of scale, the use of a single 60 Watt light bulb for four hours per day requires about 90 kWh per year. The graph shows the stark contrast between how energy access is defined and what it really means. The grey bar shows average global per capita electricity consumption for 2010 and the one above that shows projected per capita consumption for 2035. The small difference between the 2010 and 2035 numbers shows that the billions of people currently in energy poverty are not expected to exhibit modern levels of electricity consumption over the next quarter-century, meaning that the IEA assumes that billions will remain in poverty. Levels of global per capita electricity consumption compared to the IEA definition of “energy access” High (US 2010) Medium (Germany 2010) Low (Bulgaria 2010) EIA (2035 projected) World Bank (2010 actual) IEA definition of energy access 0 5,000 10,000 15,000 Annual Electricity Consumption (kilowatt hours) Source: International Energy Agency and World Bank. Assuming away emissions Billion tonnes of oil equivalent Change in energy demand and CO2 emissions under the IEA’s universal energy access scenario 20 40 15 30 10 20 5 10 0 0 Gigatonnes The consequences of assuming continued energy poverty for the next 25 years are further reflected in IEA’s projections of future carbon dioxide emissions. The minimal consequences to emissions and consumption resulting from this scenario essentially reflect a “poverty maintenance” level of energy service provision. Emissions increase by such a small amount because new energy consumption increases by a very small amount. But poor countries are unlikely to settle for such a future. Conflicts between energy and climate priorities deserve a deeper and more open airing in order to help better frame policy options, including the difficult question of tradeoffs among competing valued outcomes. Additional energy demand in the Energy for All Case Roger Pielke, Jr. (Pielke@colorado.edu) is a professor in the Environmental Studies Program and a fellow of the Cooperative Institute for Research in Environmental Sciences at the University of Colorado, Boulder. Morgan Bazilian (Morgan.bazilian@nrel.gov) is senior research scientist at the International Institute for Applied Systems Analysis, Laxenburg, Austria, and an adjunct professor at Columbia University. World energy demand in the central scenario Additional CO2 emissions in the Energy for All Case (right axis) World CO2 emissions in central scenario (right axis) Source: International Energy Agency, World Energy Outlook, 2011. FALL 2013 91


