Deere & Company (DE) - University of Oregon Investment Group
advertisement
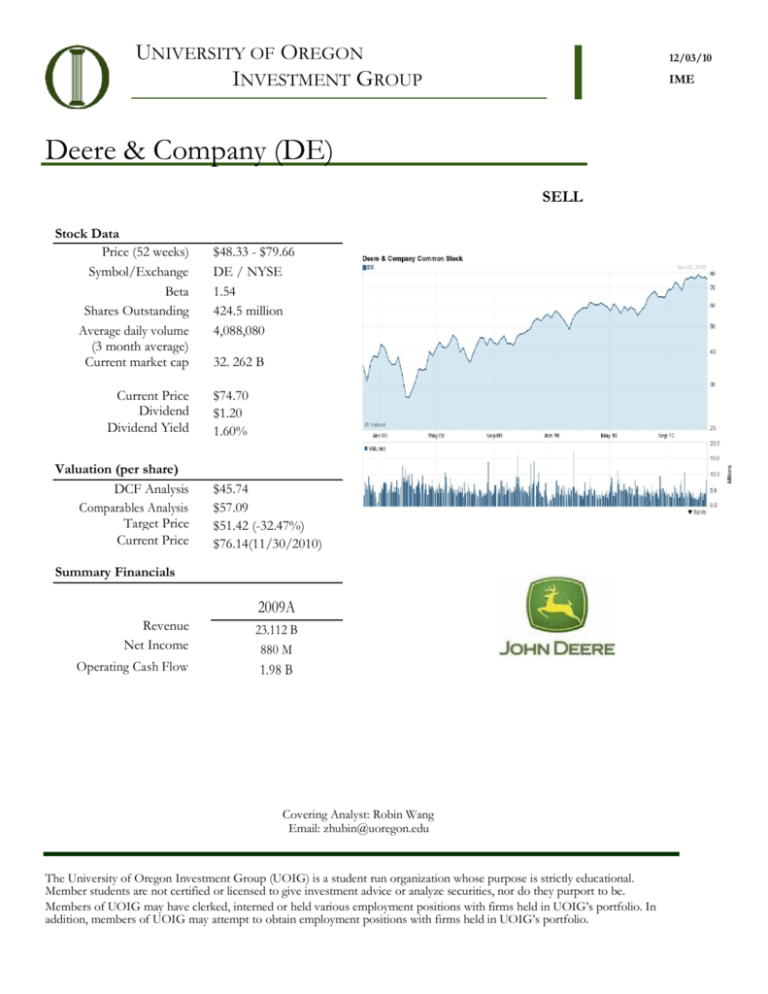
UNIVERSITY OF OREGON INVESTMENT GROUP 12/03/10 IME Deere & Company (DE) SELL Stock Data Price (52 weeks) Symbol/Exchange Beta Shares Outstanding Average daily volume (3 month average) Current market cap Current Price Dividend Dividend Yield Valuation (per share) DCF Analysis Comparables Analysis Target Price Current Price $48.33 - $79.66 DE / NYSE 1.54 424.5 million 4,088,080 32. 262 B $74.70 $1.20 1.60% $45.74 $57.09 $51.42 (-32.47%) $76.14(11/30/2010) Summary Financials 2009A Revenue Net Income Operating Cash Flow 23.112 B 880 M 1.98 B Covering Analyst: Robin Wang Email: zhubin@uoregon.edu The University of Oregon Investment Group (UOIG) is a student run organization whose purpose is strictly educational. Member students are not certified or licensed to give investment advice or analyze securities, nor do they purport to be. Members of UOIG may have clerked, interned or held various employment positions with firms held in UOIG’s portfolio. In addition, members of UOIG may attempt to obtain employment positions with firms held in UOIG’s portfolio. Deere &Company University of Oregon Investment Group http://uoig.uoregon.ed u BUSINESS OVERVIEW Deere and Company, founded in 1837, is one of the market leaders in farm and machinery industry. It is based in Moline, Illinois and contains three major business segments: Agriculture and Turf Operation and Construction and Forestry Operation and Credit Operation, together with its subsidiaries (John Deere) make up the operation profit for the entire company. These segments are all operated worldwide and can be categorized in two geographic areas: U.S. and Canada area and Outside of U.S. and Canada area. The agriculture and turf segment focuses on manufacturing and distributing a full line of equipment and service parts that are related to farm and turf such as tractors, tillage and seeding application, cotton & sugarcane harvesters, mowers, etc. Their construction and forestry segment focuses on manufacturing, distributing and selling machines and service parts used in construction, earthmoving, material handling and timber harvesting. “The credit segment primarily finances sales and leases by John Deere dealers and provides wholesale financing to dealers of the foregoing equipment, provides operating loans, finances retail revolving charge accounts, offers crop risk mitigation products and invests in wind energy generation.” BUSINESS AND GROWTH STRATEGIES Deere &Co.’s acquisition has remained a stable position and has been an experimental opportunities for it to diversify products. This firm’s major growth mainly relies on organic growth including growth of international expansion in the past ten years. Deere and Co. has completed $47 million acquisitions by the end of third quarter of 2010. The acquisition made for purchasing Israeli cotton picker. “Deere stated in December that the acquisition will expand its products and services in the company's already successful cotton picker business. Terms of the transaction were not made public.” Deere and Co has been using SVA Model for growth ever since last President Ben Lane was still there. SVA, Shareholder Value Added - essentially the difference between operating profit and pretax cost of capital – is a metric used by John Deere to evaluate business results and measure sustainable performance. This evaluation of performance has been proved effective through crisis according to a recent presentation posted on Deere’s website. The SVA of Equipment operations in 2007, 2008, and 2009 are $1.224 billion, $1.643 billion and $64 million. Deere Equipment Operations, to create and grow SVA, are targeting an operating return on average operating assets (OROA) of 20% at mid-cycle sales volumes in any given year – and other ambitious returns at other points in the cycle. 2 Deere &Company University of Oregon Investment Group http://uoig.uorego n.edu The SVA of Financial services in 2007, 2008, and 2009 are $90 million, 59 million and -148 million. Deere Financial Services, to create and grow SVA, are targeting an after-tax return on average equity of approximately 13%. The Financial Services SVA metric is calculated on a pretax basis, with certain adjustments. Operating profit is adjusted for changes in the allowance for doubtful receivables, while the actual allowance is added to the equity base. These adjustments are made to reflect actual write-offs in both income and equity. Deere & Company announced on August 31, 2010 that it has signed a definitive agreement to sell John Deere Renewables, LLC, its wind energy business, to Exelon Generation Company, LLC, a wholly-owned subsidiary of Exelon Corporation. CEO Samuel R. Allen believes that the sale would help to sharpen Deere’s strategic focus and proceeds from this $900 million sale will be invested in growing core equipment business. The wind energy business includes 36 completed projects in eight states with an operational capacity of 735 megawatts. The decision of this operational focus turns out to be a positive impact as stock price went straight up in the follow month. MANAGEMENT AND EMPLOYEE RELATIONS Sam Allen, 56 years old, is Chairman and Chief Executive Officer of Deere & Company, appointed in June 2009. He has been in the company since 1975 after graduated from Purdue University. Previously, he served as President of Worldwide Construction & Forestry Division and was responsible for the global operations of John Deere Power Systems, for Deere's intelligent mobile equipment technologies and for Deere's advanced technology and engineering. Samuel R. Allen Chairman and Chief Executive Officer Deere & Company He has served as a senior officer of the company since 2001, with additional responsibilities in human resources, industrial relations, and John Deere Credit's global operations. In addition, Allen also serves as Chairman of the Council on Competitiveness as of January 2010. He was appointed to Whirlpool Corporation's board of directors in June 2010. Samuel R. Allen is the only member among 11 people on the board who also holds position in the company, which indicates the common interest between shareholders and the board of directors. He was compensated $5.6 million in 2009 for the double responsibility he has bared. PORTFOLIO HISTORY As of November 12, 2009 John Deere has appreciated 59.95% We currently own 400 shares purchased at a cost basis of $11,856 in the Tall Firs portfolio.. Deere &Company University of Oregon Investment Group http://uoig.uoregon.edu RECENT NEWS Deere & Company Raises Dividend , Dec. 1st, 2010 “The Deere & Company Board of Directors today increased the company's dividend to $.35 a share on common stock. The new quarterly rate represents an increase of 5 cents per share over the previous level – an increase of approximately 17 percent. Since early 2004, the company has increased its quarterly dividend on eight separate occasions including today's announcement.”(Deere &Co. News Press) The SVA model sees increase dividend payout as an indicator of improvement. However, Deere is the only company in the industry using SVA valuation and it is hard to tell if investors are happy about this announcement due to a general industrial price jump for most stocks in machinery industry. Foreign firms in China no longer benefit from tax breaks, Dec. 1 st, 2010 “According to an earlier announcement made by the State Council (China's cabinet), the country has begun collecting city maintenance and construction taxes, and education-supporting taxes from foreign companies and individuals with commercial interests in the nation.” The long-term benefit for companies with large amount of revenue generated from this country, e.g. competitors like Caterpillar, could be hurt, although short term effect would not be significant. In the Industrial Equipment Battle, Ag Wins, Dec. 1st, 2010 Caterpillar and Deere& Co. are considered major winner, “the 800 pound gorilla in the industrial equipment business”, in current agflation trend. However, Deere should be favored in a while considering Caterpillar’s large growth in sale of mining equipment and constructions are slowing down as China and India’s deflating policy taking effect gradually. Caterpillar is growing rapidly with huge cost on merge and acquisition, taking great amount of risk in another way, which eventually wouldn’t be a good sign. While Deere has done the research and introducing new line of tractor in India with lower horsepower but low price, low risk for return as well. With 2010’s return posted recently, Deere’s price should be able to stay strong for a while. U.S. Agriculture Economy Expands as Exports, Profitability Head for Record, Nov. 30th, 2010 “U.S. agriculture is booming even as the broader economy struggles to recover from recession, with exports heading to a record and farmer profits near an all-time high.” “Net-farm income will rise 31 percent to $81.6 billion this calendar year as crop prices climb and livestock sales increase, according to a separate USDA forecast.” Farmer’s profit increase should have a positive impact on Deere & Co. , although risk of rise of price need to be taken account for if demand of export goes up too much. 4 Deere &Company University of Oregon Investment Group http://uoig.uoregon.edu INDUSTRY Market Position Deere & Co is one of the market leaders of the agriculture and construction machinery industry. With diversified product in three operation segments and a good management team who knows their focus clearly, the company has completed a solidly profitable year and maintained its strong financial condition in 2009 in an environment of intense global economic pressure. In 2010 as the market picks up, Deere has obtained worldwide net sales and revenues and increased 6 percent to $18,803 million for the first nine months, compared with $17,778 million a year ago. Other sizable competitors among S&P 500 include Caterpillar (CAT), Paccar (PCAR), and Cummins (CMI). Globalization of business has brought Deere oversee profit and competitors as well: Komatsu, CNH, to name just a few. Risk Factors on Expense The Company’s businesses are exposed to variety of risks and uncertainties of governmental bodies, e.g. World Trade Organization, Brazilian government. The negotiation between parties could have effect on exchange rate, commodity price and interest rate of each country indirectly. The ongoing currency war at this moment would be a good example. The net sales outside the U.S. and Canada decreased by 28 percent in fiscal year of 2009, while unfavorable effect of currency translation was included as 8 percent. Increase in raw material would have a negative impact on operating cost as well. Factors that might have effect on this include weather condition and environmental risk on regulation. Market Outlook Company equipment sales are projected to increase by about 12 percent for fiscal year 2010 and about 32 percent for the fourth quarter, compared with the same periods a year ago. Included are a favorable currency translation impact of about 2 percent for the year and an unfavorable impact of about 1 percent for the fourth quarter. For the fourth quarter, net income attributable to Deere & Company is anticipated to be approximately $375 million. Agriculture and Turf Agriculture industry is expected to be accelerated growing market with low possible downturn. The demand for food driven by 1.9 billion increases in population in 25 years would push the growth of simply just need of meet 2.4% to 3.4% per year and last at least 10 years each. The historical government support of agriculture by Deere &Company University of Oregon Investment Group http://uoig.uoregon.edu China from 2004-2010 has increased from 0 to 83 billion of RMB. Meanwhile, government support of Agriculture from Brazil approved in 2010-2011 alone is R$116 billion, remaining 100 billion targeted to Agribusiness. The government equipment purchases consisted of long terms and high interest rate is definitely a good catalysis for the recovering industry. Construction and Forestry The worldwide construction spending has been going up in 3.6% since 2008 eventually reaching to 9915 billion in 2020, with China surpassing the USA and becoming largest market for construction in 2020. In 2020 7 out of top 10 construction spending countries will be emerging market and catching the trend will be essential for construction segment. In addition, innovation in environmental care product is the major concern in R&D segment. Credit Credit revenue of Deere from Agriculture segment maintains relatively low return but excellent collection, and construction segment is more fluctuated and reflects market risk. Sources of liquidity are mainly provide by long term debt, and about 10-20% from commercial papers. This is provided by historical data of Deere& Co. and would not be representative for the market. S.W.O.T. ANALYSIS Strengths Strong brand name, leader in the industry products and high customer loyalty Strong revenue performance with high potential sale growth in construction and forestry segment Diversified portfolio and active risk management Weaknesses Growing amount of income expense due to higher postretirement benefit cost Few-environmental friendly product, considering recent sale in August of Deere’s only Wind Energy Project Opportunities Revenue increase projected in US, Canada market once economic picks up in 2011 Increasing demand of agriculture equipment in China and other emerging market 6 Deere &Company University of Oregon Investment Group http://uoig.uoregon.edu Interim Tier 4 Emissions Technology to meet emission regulation Uncertainty of currency exchange fluctuations effects on revenue due to international market expansion Uncertainty of commodity prices fluctuations adversely effects on revenue Market slowdown in Europe Operation Segment showing little sign of recovering Threats PORTER’S 5 FORCES ANALYSIS Supplier Power Supplier Power varies among companies in the industry. Deere &Co seeks out for small diverse suppliers and in high unemployment or emerging economic area maintains weak supplier power. The biggest competitor Caterpillar on the other hand offers more rights to suppliers and seeks for mutually symbiotic relationship. Barriers to Entry Several barriers of entry in the industry due to high requirement on Capital Expenditures cost and brand recognition of the big companies may stop newcomers to start-up in any new market and demonstrate their competiveness to loyalty customers. The economics of scales of this industry would also discourage them. Buyer Power Buyers are mostly consisted of farmers, who demand not only low price but also performance and efficiency of product. Their loyalty is essential to firms due to the competitive nature of this industry, therefore after sale service is also a large part of business. Threat of Substitutes These machines made in agricultural industry have been well developed and all the competitors spend huge R&D expense searching for minor cost development or service improvement, e.g. the crop insurance provided by Deere. Major threat of substitutes would lie in construction equipment operating segment. Degree of Rivalry With more international competitors’ from Japan or Europe participating, this industry is more competitive than ever. Integrating and diversifying are their methods of expansion. Nevertheless, there are always small niche manufacturers trying to share a part of the benefit. 7 Deere &Company University of Oregon Invest ment Group http://uoig.uoregon.edu CATALYSTS Upside Large potential for growth in emerging markets and economies. New product launched will positively impact on Deere, especially improvement in environmentalfriendly ones Downside Severe fluctuations in weather and any other negative impact on commodity price, e.g. interest rate, exchange rate of currency Government policies changes to regulate trading and financial activities or environment COMPARABLES ANALYSIS Caterpillar (CAT) (20%) Caterpillar produces construction equipment and mining equipment, diesel and natural gas engines, and industrial turbines. It also includes unique logistics services for business other partners which provide integrated supply chain services for Caterpillar and 50 other companies worldwide. Caterpillar’s products in machinery are very similar and the target market as well. It has been involved heavily vertical integration through R&D and acquisition. The company is also based in Illinois and was founded in 1925. Caterpillar has a market cap of $55 billion, $24 billion larger than Deere & Co. as well as its position one year before. The growth of size is mainly contributed by active acquisitions in emerging market and China and product diversification. The general economic factor affects Caterpillar is still similar to Deere &Co, but probably not any more in one year if it continues to grow in this rate. Nevertheless, it is one big competitor of Deere &Co. and 20% weighted average is considered fair value. CNH Global N.V. (20%) CNH is the merge of Case and New Holland in Nov. 1999. They operate three main segments agricultural segment, construction segment and financial segment make up their business structure, which is very similarly to Deere and 8 Co. And it also provides identical products to Deere& Co. This company is based in Amsterdam but mainly operates in both western Europe and U.S. And it has not recovered from integration hardship brought by merger until restructuring in 2005. The EV/ Gross Profit and EV/ OCF are similar of the two, so is the capital structure(if CNH could get rid of the heavy debt burden from merger) and sooner or later this company should be able to compete for the same market share and customers just like Deere & Co. I give it 20% weighted average. Komatsu Ltd. (20%) Komatsu is considered the world's second largest manufacturer of construction equipment and mining equipment after Caterpillar. It has manufacturing operations in Japan, Asia, Americas and Europe. The Market Cap of Komatsu is similar to Deere &Co, so does the revenue in dollars. But Komatsu was able to generate cash flow as strong as Deere with smaller revenue and enterprise size. Considering the global environment of business and Deere’s growth potential in construction segment, Komatsu deserves 20% weighted average as a good competitor. Cummins Inc. Cummins Inc. holds business in the designing, manufacturing, distributing and servicing diesel and natural gas engines, electric power generation systems and engine-related component products, including filtration and exhaust after treatment, fuel systems, controls and air handling systems. The Company operates in different structure but produces some similar products in engine systems. The market risk factors for Cummins Inc. are similar considering its width of business operation. Besides, the profitable margins of both companies are very identical and debt ratio as well. 20% weight average is believed to be fair. Lindsay Co. Lindsay Corporation (Lindsay) is a designer and manufacturer of self-propelled center pivot and lateral move irrigation systems used in the agricultural industry to increase or stabilize crop production. The Company also manufactures and markets various infrastructure products. On August 31, 2010, the Company acquired Digitec, Inc. which would further catalyze Lindsay’s innovation. Based in Nebraska, Lindsay is founded in 1955. Considering Deere’s recent purchase of irrigation system and its market demographic, this fast growing niche company will be a good part of indicators for valuing 20% as comparable. 9 DISCOUNTED CASH FLOW ANALYSIS 2010 annual data was projected based on same methods of projecting future 8 years unless information provided in New Press or inconsistent with three quarter’s data. Beta I ran a five year monthly regression with Deere against The S & P 500 and derived a beta of 1.54, standard deviation 0.16. This seems reasonable with industrial average about 1.81 and Deere as one of the leading companies deserves a lower beta. It is also reasonable since last year’s Beta was 1.62 and market was more risky by then. Revenue Deere & Co. has already completed their fourth quarter for 2010, but they have not released a Quarter 4 report, although projected revenue growth of fiscal 2010 to be 12% growth. Revenue was break down into operation segment and geographic areas, each should be more detailed and accurate to project revenue. I set up projection model for both method decided to choose the more reasonable outcome, which turned out to be operation segment breakdown. The regional method follows growth given by 10-K and 10-Q and terminal growth 3%. Each equipment segment maintains a stable fixed portion of revenue in that area and there goes the financial revenue and total regional revenue. A growth of 6.86% in 2010 is fairly illegitimate. The growth of 2010 agriculture and turf segment is stated 8% and construction and forestry as 35% percent. I assumed construction and forestry segment will not have a big decrease in growth, about -5% each year is projected. Credit revenues Credit revenue has remained pretty constant of an average of 8.2% over the previous years and I see no reason for it to increase in the future. I have averaged the years 2006-2008 and used that average to project my percentages in the future. I have finance and interest income slightly going down the closer it gets to the terminal growth rate. Other Income Other Income has remained average 1.8% of revenue and I used this to forecast since it remained stable in past three years. It increased in the third quarter and first nine months this year primarily due to an increase in wind energy income in both periods and higher crop insurance commissions’ year to date. The total growth in 2010 is 12.93% relative more reasonable. 10 Cost of Sales Cost of Sales to net sales ratios for the third quarter and first nine months of 2010 were 72.6 percent and 73.4 percent, respectively, compared to 76.8 percent and 77.1 percent in the same periods last year. The third quarter improvement was primarily due to the impact of higher production volumes and improved price realization, partially offset by higher postretirement benefit costs. The nine month improvement was also affected by lower raw material costs and the favorable effects of foreign currency exchange. This improvement is assumed to be substantial and thus projected through the following years. R & D Expense Research and Development expense growth at constant rate averaging 3.64%. Deere & Co. has been actively involved in this department this rate will be fair for Deere& Co. Cost of Debt I got an estimated cost of debt around 5.375% Derived from recently issued note that are due to mature in the year 2029. SG&A SG&A expense were higher in the third quarter and first nine months primarily due to increased compensation expenses and higher postretirement benefit costs, with the third quarter also affected by foreign currency translation. I left it at 11.11% by taking average of previous year. Interest Expense and Other Expense Interest expense decreased in both periods due to lower average borrowing rates and borrowings. I kept it as 1.45% remaining historical level in the future since economic has recovered. Other operating expenses were higher in the third quarter primarily due to an increase in foreign currency exchange losses and this loss should be temporary. Long term fluctuation of currency should average out and I used constant 4.43% for Other operating expenses. Tax Rate The effective tax rate for the provision for income taxes was higher in the third quarter primarily due to lower tax credits related to wind energy projects. In the first nine months, the effective tax rate was higher primarily due to the effect of the tax charge related to the enactment of the new health care legislation and lower tax credits related to wind energy projects. In essence long term tax rate should remain constant which is the average of previous, 34.09%. 11 Equity in Unconsolidated Affiliates Deere & Co. receives income from the subsidiaries it owns. It usually owns between 20-50% of all the shares outstanding in the company. By comparing other comparable companies in the industry, most of them have not taken account of this into Net Income and I decided to neglect its impact too. Depreciation and Amortization Depreciation has remained very constant around 3.26% and there is no reason for it to increase or decrease drastically for the future years. However in Deere’s Income Statement, Depreciation and Amortization is included and I did not double count it in EBIT. Capital Expenditures & Acquisitions Deere & Co. makes purchase on business moderately and average 0.63%of last three years of Acquisitions is moderate. Deere & Co. has stated that Capital Expenditure depends on the restructuring and modernization of key production plants in the future. Research and Development is also another big CAPEX cost and this should see increases in the future as well. Average of 11.11% in long term is higher than historical but I believe this is appropriate. RECOMMENDATION Deere and CO. produces fundamental industrial product and generates strong cash flow with good potential growth, but current price of Deere &Co is clearly overvalued. DCF assumptions gave me an implied price of $45.74, comparable analysis offers $57.09, Valuation($ per share) DCF Price $ 45.74 Comparable Price $ 57.09 Target Price $ 51.42 Current Price $ 76.14 Under (Over) Valued -32.47% 50% 50% overvaluation of 39.1%. I weighted my target price 50/50 and got a price of $48.01, overvalued of 35.7%. I am recommending a sell for the Tall Firs portfolio. 12 Deere &Company APPENDIX 1 – Comparable Analysis University of Oregon Investment Group The University of Oregon Investment Group ($ in millions, except per share data) Stock Characteristics Current Price 50 Day Moving Avg. 200 Day Moving Avg. Beta Size(in millions) ST Debt (MRQ) LT Debt (MRQ) Cash and Cash Equiv. (MRQ) Minority Interest Market Value Preferred Stock Diluted Share Count Market Cap Enterprise Value Profitability Margins Gross Margin EBIT Margin EBITDA Margin Net Margin Credit Metrics Interest Expense (MRQ) Debt/Equity (MRQ) Debt/EBITDA (LTM) EBITDA/Interest Expense (LTM) Operating Results Revenue (LTM) Gross Profit (LTM) EBITDA (LTM) Free Cash Flow (LTM) OCF Valuation EV/Revenue EV/Gross Profit EV/EBITDA EV/OCF 20.00% 20.00% 20.00% 20.00% 20.00% Weighted Avg CAT CNH KMTUY CMI LNN DE Max Min $ 100.52 ##### $ 93.05 ##### $ 80.50 ##### 2.64 1.35 Avg. $ 65.98 $ 62.45 $ 52.23 1.84 Median $ 68.22 $ $ 66.73 $ $ 54.07 $ 1.71 76.14 $ 76.59 $ 66.46 $ 1.54 87.45 $ 80.82 $ 70.63 $ 1.85 43.19 $ 41.86 $ 32.54 $ 2.64 28.30 $ 25.54 $ 21.57 $ 1.35 100.52 $ 93.05 $ 80.50 $ 2.1 60.29 56.86 41.67 1.57 $ $ $ $ 63.95 59.63 49.38 1.90 15,514.0 31,132.0 3,753.7 30.8 8.6 83.4 4,933.4 10,707.4 1,550.0 2,784.5 7,998.8 1,130.3 7,486 16,374 3,754 0 15,514 31,132 2,265 0 3,736 12,126 1,182 0 1,001 3,872 1,079 0 1,833 732 937 0 30.79 8.57 83.42 0 4,422.99 9,574.01 1,109.20 - 968 56,982 101,363 12 751 707 415 24,578 38,669 331 23,567 28,078 424.5 32,321 52,428 651.6 56,982 101,363 238.0 10,279 24,959 968.3 27,403 31,197 196.3 19,732 21,360 12.45 750.67 706.61 413 23,029 35,917 26.63% 10.59% 14.61% 5.74% 26.53% 10.76% 14.72% 6.39% 30.44% 13.10% 16.98% 7.79% 28.69% 10.82% 16.77% 5.24% 23.93% 7.61% 10.81% 1.68% 25.47% 9.32% 14.81% 5.90% 23.68% 12.00% 14.62% 6.88% 27.59% 10.70% 13.69% 6.94% 1.557 127.4745 106.145 5.2% 57.7% 45.8% 0.80 4.50 3.82 2.08 15.57 4.77 193 73.8% 5.96 4.64 312 82% 7.38 4.91 228 154% 9.74 2.08 19.19 18% 1.68 2.21 11 13% 1.40 48.05 1.557 5% 80% 31.50 30.44% 23.68% 13.10% 7.61% 16.98% 10.81% 7.79% 1.68% 312 154.3% 9.74 48.05 37,679 10,809 6,318 2,420 358 99 49 (3,121) 2.69 x 1.59 x 9.38 x 6.26 x 16.04 x 10.76 x 21.06 x 13.66 x 18,121 4,938 2,787 348 17,321 4,295 2,362 736 23,560 7,171 4,001 1,302 2,670 37,679 10,809 6,318 2,420 5,113 15,063 3,604 1,628 -3,121 1,185 19,578 4,986 2,899 1,009 2,284 12,487 2,957 1,826 464 1,392 358.4 98.9 49.0 13.8 36.6 1.97 x 7.37 x 13.56 x 18.14 x 1.84 x 7.18 x 13.75 x 19.47 x 2.23 x 7.31 x 13.10 x 19.64 x 2.69 x 9.38 x 16.04 x 19.82 x 1.66 x 6.93 x 15.33 x 21.06 x 1.59 x 6.26 x 10.76 x 13.66 x 1.71 x 7.22 x 11.70 x 15.34 x 1.97 x 7.14 x 14.41 x 19.29 x Implied Price $ 59.45 $ 58.78 $ 62.46 $ 47.67 Weight 25.00% 25.00% 25.00% 25.00% Metric EV/Revenue EV/Gross Profit EV/EBITDA EV/OCF Price Target Current Price Under (Over) Valued $ $ 57.09 76.14 -25.02% 25.9% 10.1% 14.1% 5.3% 114.35 0.54 4.20 17.75 17,033 4,491 2,544 157 2,002 Weighted Avg. 1.92 x 6.28 x 11.65 x 15.11 x APPENDIX 2 – DISCOUNTED CASH FLOW ANALYSIS The University of Oregon Investment Group ($ in millions, except per share data) Total Company Revenue % Y/Y Growth Cost of Revenue % Revenue Gross Profit Gross Margin Operating Expenses SG&A % Revenue R&D % Revenue D&A % Revenue Total Operating Expenses % Revenue EBIT % Revenue Other (Expense) Income % Revenue Interest Expense % Revenue Pre-tax Income % Revenue Less Taxes (Benefit) Tax Rate Net Income Net Margin Add Back Depreciation and Ammortization % Revenue Add Back Interest Expense*(1-Tax Rate) % Revenue Operating Cash Flow % Revenue Current Assets % Revenue Current Liabilities % Revenue Net Working Capital % Revenue Change in Net Working Capital Capital Expenditures % Revenue Acquistions % Revenue Unlevered Free Cash Flow Discounted Unlevered Free Cash Flows 2007 24,082.2 16,252.8 67.49% 7,829.4 32.51% 2008 28,437.6 18.09% 19,574.8 68.83% 8,862.8 31.17% 2,620.8 10.88% 816.8 3.39% 744.4 3.09% 4,182.0 17.37% 4,391.8 18.24% (268) -1.11% 1,151 4.78% 3,717.0 15.43% 883 33.00% 1,793 7.44% 744 3.1% 771 3.2% 3,308.17 13.7% 30,945 128.5% 15,922 66.1% 15,024 62.4% 1,025 4.26% 189 0.79% 2,094 2,960.2 10.41% 943 3.32% 831 2.92% 4,734.2 16.65% 4,959.6 17.44% (391) -1.37% 1,137 4.00% 4,262.6 14.99% 1,111 35.57% 2,013 7.08% 831 2.9% 733 2.6% 3,576 12.6% 30,916 108.7% 15,255 53.6% 15,661 55.1% 637 1,117 3.93% 252 0.89% 1,570 2009 2010 3Q 23,112.4 18,803.6 -18.73% 16,255.2 12,490.3 70.33% 66.43% 6,857.2 6,313.3 29.67% 33.57% 2,780.6 12.03% 977 4.23% 873.3 3.78% 4,630.9 20.04% 3,099.6 13.41% (429) -1.86% 1,042 4.51% 2,501.5 10.82% 460 34.33% 880 3.81% 873 3.8% 685 3.0% 2,438 10.5% 33,662 145.6% 12,753 55.2% 20,909 90.5% 5,249 767 3.32% 49.8 0.22% (3,628) 2,126.5 11.31% 758.1 4.03% 692.9 3.68% 3,577.5 19.03% 3,428.7 18.23% (92) -0.49% 618.9 3.29% 3,411.2 18.14% 866.4 37.98% 1,414.9 7.52% 692.9 3.7% 384 2.0% 2,492 13.3% 34,652 184.3% 13,636 72.5% 21,016 111.8% 107 432 2.30% 43.1 0.23% 1,910 11.1% 6.0% 1.3% 4.2% 5.4% 6.9% 7.6% 8.1% 0 2010E 26,100.1 12.93% 17,338.3 66.43% 8,761.8 33.57% 1 2011 E 29,697.9 13.78% 19,728.3 66.43% 9,969.6 33.57% 2 2012 E 33,734.4 13.59% 22,409.8 66.43% 11,324.6 33.57% 3 2013 E 36,729.3 8.88% 24,399.2 66.43% 12,330.0 33.57% 4 2014 E 39,265.8 6.91% 26,084.3 66.43% 13,181.5 33.57% 5 2015 E 41,084.5 4.63% 27,292.4 66.43% 13,792.1 33.57% 6 2016 E 42,619.1 3.74% 28,311.9 66.43% 14,307.2 33.57% 7 2017 E 43,897.7 3.00% 29,161.2 66.43% 14,736.4 33.57% 8.1% 45,214.6 3.00% 30,036.1 66.43% 15,178.5 33.57% 2,900 11.11% 950 3.64% 851 3.26% 4,700.6 18.01% 4,912 18.82% (378) -1.45% 1,156 4.43% 3377.4 12.94% 1151.34 34.09% 2,226.0 8.53% 850.9 3.3% 762 2.9% 3,839.0 14.7% 36,292 139.1% 15,339 58.8% 20,953 80% (63) 850 3.26% 164.4 0.63% 2,888 2,888 3,299 11.11% 1,081 3.64% 968 3.26% 5,348.6 18.01% 5,589.1 18.82% (431) -1.45% 1,316 4.43% 3842.9 12.94% 1310.05 34.09% 2,532.9 8.53% 968.2 3.3% 867 2.9% 4,368.1 14.7% 39,664 133.6% 17,453 58.8% 22,211 75% 1,258 1,134.46 3.82% 187.1 0.63% 1,789 1,623 3,748 11.11% 1,228 3.64% 1,100 3.26% 6,075.6 18.01% 6,348.8 18.82% (489) -1.45% 1,494 4.43% 4365.2 12.94% 1488.11 34.09% 2,877.1 8.53% 1,099.7 3.3% 985 2.9% 4,961.9 14.7% 45,056 133.6% 19,826 58.8% 25,230 75% 3,019 1,288.66 3.82% 212.5 0.63% 442 364 4,081 11.11% 1,337 3.64% 1,197 3.26% 6,614.9 18.01% 6,912.4 18.82% (533) -1.45% 1,627 4.43% 4752.8 12.94% 1620.22 34.09% 3,132.5 8.53% 1,197.4 3.3% 1,072 2.9% 5,402.3 14.7% 49,056 133.6% 21,586 58.8% 27,470 75% 2,240 1,403.06 3.82% 231.4 0.63% 1,528 1,141 4,362 11.11% 1,429 3.64% 1,280 3.26% 7,071.8 18.01% 7,389.8 18.82% (569) -1.45% 1,739 4.43% 5081.0 12.94% 1732.11 34.09% 3,348.9 8.53% 1,280.1 3.3% 1,146 2.9% 5,775.4 14.7% 52,443 133.6% 23,077 58.8% 29,367 75% 1,897 1,499.96 3.82% 247.4 0.63% 2,131 1,444 4,564 11.11% 1,495 3.64% 1,339 3.26% 7,399.3 18.01% 7,732.1 18.82% (596) -1.45% 1,820 4.43% 5316.3 12.94% 1812.34 34.09% 3,504.0 8.53% 1,339.4 3.3% 1,200 2.9% 6,042.9 14.7% 54,872 133.6% 24,145 58.8% 30,727 75% 1,360 1,569.43 3.82% 258.8 0.63% 2,854 1,754 4,735 11.11% 1,551 3.64% 1,389 3.26% 7,675.7 18.01% 8,020.9 18.82% (618) -1.45% 1,888 4.43% 5514.9 12.94% 1880.03 34.09% 3,634.9 8.53% 1,389.4 3.3% 1,244 2.9% 6,268.7 14.7% 56,922 133.6% 25,047 58.8% 31,875 75% 1,148 1,628.05 3.82% 268.5 0.63% 3,224 1,798 4,877 11.11% 1,598 3.64% 1,431 3.26% 7,906.0 18.01% 8,261.5 18.82% (637) -1.45% 1,945 4.43% 5680.4 12.94% 1936.43 34.09% 3,743.9 8.53% 1,431.1 3.3% 1,282 2.9% 6,456.7 14.7% 58,630 133.6% 25,799 58.8% 32,831 75% 956 1,676.89 3.82% 276.6 0.63% 3,547 1,794 5,023 11.11% 1,646 3.64% 1,474 3.26% 8,143.2 18.01% 8,509.4 18.82% (656) -1.45% 2,003 4.43% 5850.8 12.94% 1994.53 34.09% 3,856.2 8.53% 1,474.0 3.3% 1,320 2.9% 6,650.4 14.7% 60,389 133.6% 26,573 58.8% 33,816 75% 985 1,727 3.82% 284.9 0.63% 3,653 1,676 8 2018 E APPENDIX 3 – DISCOUNTED CASH FLOWS ANALYSIS ASSUMPTIONS Assumptions for Discounted Free Cash Flows Model Tax Rate 34.09% Terminal Growth Rate Risk-Free Rate 2.84% Terminal Value 30 yr Risk-Free Rate 4.16% PV of Terminal Value Beta 1.54 Sum of PV Free Cash Flows Market Risk Premium 7% Firm Value % Equity 66.37% LT Debt % Debt 33.63% Cash Cost of Debt* 5.4% Equity Value CAPM 13.61% Diluted Share Count WACC 10.23% Implied Price Terminal WACC 11.10% Current Price Under (Over) Valued 3% 46,440 21,311 14,481 35,792 16,374 3,754 19,417 425 45.74 76 -39.8% *: newly issued 5.375% notes due 2029 APPENDIX 4 – Beta Analysis Beta 1.88 1.79 1.71 1.62 1.54 1.45 1.37 1.29 1.20 St. Deviation Implied Price Under (Over) Valued 2.00 $31.69 -58.30% 1.50 $34.86 -54.13% 1.00 $38.31 -49.59% 0.50 $42.10 -44.61% 0.00 $45.74 -39.81% -0.50 $50.85 -33.09% -1.00 $55.95 -26.38% -1.50 $61.65 -18.88% -2.00 $68.04 -10.47% Beta Standard error 3-yr m 1.61 5-yr m 1.54 3-yr wk 1.40 0.17 0.16 0.11 Bond Rating Senior Long-Term Short-Term Outlook Moody’s Investors Service,A2 Inc. Prime-1 Stable Standard & Poor’s A A-1 Stable APPENDIX 5 Revenue Analyses 6 The University of Oregon Investment Group ($ in millions, except per share data) Net Sale Finance and Interest Other income Total 2007 2008 2009 2010 2011 2012 2013 2014 2015 2016 2017 2018 21,489 89% 2,055 9% 538 24,082 25,804 91% 2,068 7% 566 28,438 20,756 90% 1,842 8% 514 23,112 23,297 90% 2,071 8% 518 25,886 25,627 90% 2,278 8% 569 28,474 28,190 90% 2,506 8% 626 31,322 29,881 90% 2,656 8% 664 33,201 31,674 90% 2,815 8% 704 35,193 32,624 90% 2,900 8% 725 36,249 33,603 90% 2,987 8% 747 37,337 34,611 90% 3,077 8% 769 38,457 35,649 90% 3,169 8% 792 39,610 18.09% -18.73% 12.00% 10.0% 10.00% 6.00% 6.00% 3.00% 3.00% 3.00% 3.00% 2007 2008 2009 2010 2011 2012 2013 2014 2015 2016 2017 2018 13,829 88% 1,925 12% 15,754 65.4% 15,068 88% 1,997 12% 17,065 60.0% 13,022 88% 1,801 12% 14,823 64.1% 21,734 88% 2,964 12% 15,861 64.2% 23,566 88% 3,213.6 12% 16,971 63.4% 25,561 88% 3,485.6 12% 18,159 62.5% 26,328 88% 3,590.2 12% 18,704 62.5% 27,118 88% 3,697.9 12% 19,265 62.5% 27,931 88% 3,808.8 12% 19,843 62.5% 28,769 88% 3,923.1 12% 20,438 62.5% 29,632 88% 4,040.7 12% 21,051 62.5% 30,521 88% 4,162.0 12% 21,683 62.5% 7,660 97% 234 3.0% 7,894 33% 434 1.8% 24,082 10,735 98% 273 2.5% 11,008 39% 365 1.3% 28,438 7,734 97% 227 2.9% 7,961 34% 328 1.4% 23,112 23,956.41 97% 740.92 3% 8,837 36% 295.2 1.5% 24,697 25,976 97% 803.39 3% 9,809 37% 401.7 1.5% 26,780 28,175 97% 871.40 3% 10,888 37% 435.7 1.5% 29,047 29,020 97% 897.54 3% 11,214 37% 448.8 1.5% 29,918 29,891 97% 924.46 3% 11,551 37% 462.2 1.5% 30,815 30,788 97% 952.20 3% 11,897 37% 476.1 1.5% 31,740 31,711 97% 980.76 3% 12,254 37% 490.4 1.5% 32,692 32,663 97% 1,010.2 3% 12,622 37% 505.1 1.5% 33,673 33,643 97% 1,040.5 3% 13,000 37% 520.2 1.5% 34,683 18.09% -18.73% 6.86% 8.43% 8.47% 3.00% 3.00% 3.00% 3.00% 3.00% 3.00% 2007 2008 2009 2010 2011 2012 2013 2014 2015 2016 2017 2018 16,454 20,985 27.5% 4,818 -4.3% 25,803 20.1% 90.7% 2,190 7.7% 445 1.6% 28,438 18,122 -13.6% 2,634 -45.3% 20,756 -19.6% 89.8% 1,930 8.4% 426 1.8% 23,112 19,934 10.0% 3,556 35.0% 23,490 13.2% 90.0% 2,140 8.2% 469.8 1.8% 26,100 21,928 10.0% 4,800 35.0% 26,728 13.8% 90.0% 2,435 8.2% 534.6 1.8% 29,698 24,120 10.0% 6,241 30.0% 30,361 13.6% 90.0% 2,766 8.2% 607.2 1.8% 33,734 25,568 6.0% 7,489 20.0% 33,056 8.9% 90.0% 3,012 8.2% 661.1 1.8% 36,729 27,102 6.0% 8,238 10.0% 35,339 6.9% 90.0% 3,220 8.2% 706.8 1.8% 39,266 27,915 3.0% 9,061 10.0% 36,976 4.6% 90.0% 3,369 8.2% 739.5 1.8% 41,085 28,752 3.0% 9,605 6.0% 38,357 3.7% 90.0% 3,495 8.2% 767.1 1.8% 42,619 29,615 3.0% 9,893 3.0% 39,508 3.0% 90.0% 3,600 8.2% 790.2 1.8% 43,898 30,503 3.0% 10,190 3.0% 40,693 3.0% 90.0% 3,708 8.2% 813.9 1.8% 45,215 18.09% -18.73% 12.93% 13.78% 13.59% 8.88% 6.91% 4.63% 3.74% 3.00% 3.00% growth GEOGRAPHIC AREAS Net sales and revenues Unaffiliated customers: U.S. and Canada: Equipment Operations net sales (88%)* Financial Services revenues (83%)* Total Outside U.S. and Canada: Equipment Operations net sales Financial Services revenues Total Other revenues Total growth OPERATING SEGMENTS Net sales and revenues Unaffiliated customers: Agriculture and turf net sales g% Construction and forestry net sales g% Total net sales g% %revenue Credit revenues %revenue Other revenues* %revenue Total growth 5,035 21,489 89.2% 2,094 8.7% 499 2.1% 24,082 Deere &Company University of Oregon Investment Group http://uoig.uoregon.edu APPENDIX 6 –NET WORKING CAPITAL PROJECTIONS 17 The University of Oregon Investment Group ($ in millions, except per share data) Net Revenues Current Assets Cash and Cash Equivalents % of Revenues A/R % of Revenues Prepaid Expenses and Other Current Assets % of Revenues Deferred Tax Assets % of Revenues Total Current Assets % of Revenues 2007 21,489 2008 25,803 2009 20,756 2010 3Q 18,803 2010 23,490 2011 E 26,728 2012 E 30,361 2013 E 33,056 2014 E 35,339 2015 E 36,976 2016 E 38,357 2017 E 39,508 2018 E 40,693 2,278.6 10.6% 21,601.1 100.5% 5,665.9 26.4% 1,399.5 6.5% 30,945.1 144.0% 2,211.4 8.6% 21,606.0 83.7% 5,657.8 21.9% 1,440.6 5.6% 30,915.8 120% 4,651.7 22.4% 21,882.9 105.4% 4,322.6 20.8% 2,804.8 13.5% 33,662.0 162% 3,753.7 20.0% 23,120.1 123.0% 5,185.6 27.6% 2,592.5 13.8% 34,651.9 184% 4,698.0 20.0% 24,194.8 103% 5,402.7 23% 1,996.7 8.50% 36,292.2 155% 3,715.2 13.9% 27,529.9 103% 6,147.5 23% 2,271.9 8.50% 39,664.5 148% 4,220.2 13.9% 31,271.8 103% 6,983.0 23% 2,580.7 8.50% 45,055.7 148% 4,594.8 13.9% 34,048.0 103% 7,603.0 23% 2,809.8 8.50% 49,055.6 148% 4,912.2 13.9% 36,399.4 103% 8,128.0 23% 3,003.8 8.50% 52,443.5 148% 5,139.7 13.9% 38,085.4 103% 8,504.5 23% 3,143.0 8.50% 54,872.5 148% 5,331.6 13.9% 39,507.9 103% 8,822.2 23% 3,260.4 8.50% 56,922.1 148% 5,491.6 13.9% 40,693.1 103% 9,086.8 23% 3,358.2 8.50% 58,629.7 148% 5,656.3 13.9% 41,913.9 103% 9,359.4 23% 3,458.9 8.50% 60,388.6 148% 6,393.6 25% 169.2 0.7% 5,371.4 26% 55.0 0.3% 5,855.5 31% 161.3 0.9% 6,107.4 26% 117.5 0.50% 6,949.3 26% 133.6 0.50% 7,893.9 26% 151.8 0.50% 8,594.6 26% 165.3 0.50% 9,188.2 26% 176.7 0.50% 9,613.8 26% 184.9 0.50% 9,972.9 26% 191.8 0.50% 10,272.1 26% 197.5 0.50% 10,580.2 26% 203.5 0.50% 171.8 0.7% 167.3 0.8% 133.2 0.7% 187.9 0.80% 213.8 0.80% 242.9 0.80% 264.5 0.80% 282.7 0.80% 295.8 0.80% 306.9 0.80% 316.1 0.80% 325.5 0.80% 8,520.5 33% 15,255.1 59.1% 7,158.9 34% 12,752.6 61.4% 7,485.7 40% 13,635.7 72.5% 8,926.2 38% 15,339.0 65% 10,156.7 38% 17,453.4 65% 11,537.2 38% 19,825.7 65% 12,561.4 38% 21,585.8 65% 13,428.9 38% 23,076.5 65% 14,050.9 38% 24,145.4 65% 14,575.7 38% 25,047.2 65% 15,013.0 38% 25,798.7 65% 15,463.4 38% 26,572.6 65% Current Liabilities A/P 5632.2 % of Revenues 26% Accrued Revenue Share Obligation and Rebates 136.5 % of Revenues 0.6% Accrued Payroll and Benefits % of Revenues Other Accrued Expenses 183.4 % of Revenues 0.9% Deferred Revenue % of Revenues Deferred Purchase Consideration % of Revenues Current Portion of N/P % of Revenues Current Portion of Finance Obligation 9969.4 % of Revenues 46% Total Current Liabilities 15,921.5 % of Revenues 74.1% Deere &Company University of Oregon Investment Gr oup http://uoig.uoregon.edu APPENDIX 7 – SOURCES Deere & Co. , Caterpillar, CNH, Komatsu, Cummin Inc. and Lindsay Co.’s10k, 10Q’s Deere & Co.’s website Yahoo!Finance Bloomberg Wall Street Journal Cameron Patrick’s 2009 Report 18

