Azeotropic distillation Example 1
advertisement
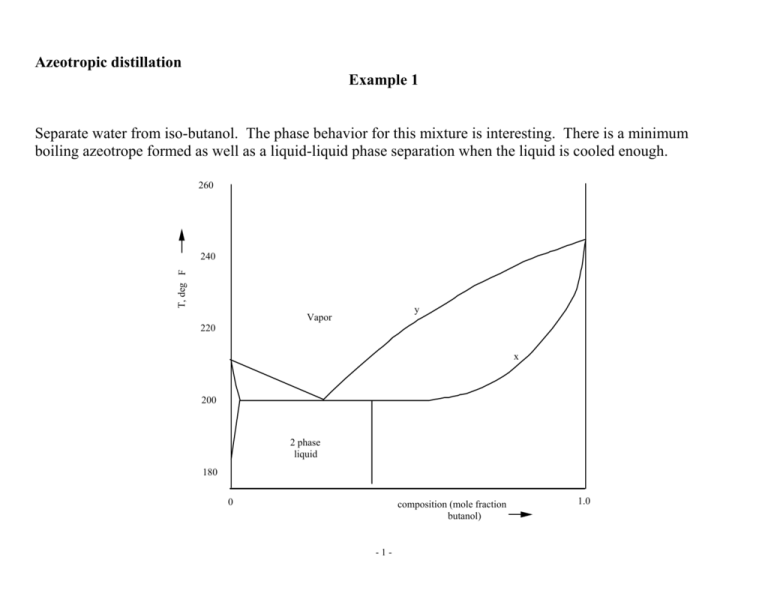
Azeotropic distillation Example 1 Separate water from iso-butanol. The phase behavior for this mixture is interesting. There is a minimum boiling azeotrope formed as well as a liquid-liquid phase separation when the liquid is cooled enough. 260 T, deg F 240 y Vapor 220 x 200 2 phase liquid 180 0 composition (mole fraction butanol) -1- 1.0 A convenient representation to look at this problem is the following which shows the key points along the composition axis composition column 1 feed mixer, decanter column 2 pure water -2- pure isobutanol azeotrope azeotrope decanter feed column 2 column 1 isobutanol -3- water Question: how would you design the system for the following feed? composition feed -4- Residue curves and distillation boundaries Doherty and coworkers and Stichlmair and Fair described residue curves, and as we shall see shortly, distillation boundaries for azeotropic mixtures. They describe them almost exclusively for three component mixtures. The two approaches are similar but not exactly the same. Doherty et al Integrate the trajectory in composition space described by the equations dx1 = x - y = x - K x 1 1 1 1 1 dt dx 2 = x - K x 2 2 2 dt dx 3 = x - K x 3 3 3 dt and plot on a triangular diagram. Note, the xi's sum to unity so one of these equations is not independent. -5- Stichlmair and Fair Step from any point to another by assuming one is operating a total reflux column. 1 2 n x n L y n V n+1 n+1 Total reflux column (no feed or product) -6- Material balance equations Vn+1 = Ln yn+1,i Vn+1 = xn,i Ln therefore yn+1,i = xn,i (1) Equilibrium gives yn+1,i = Kn+1,i xn+1,i (2) Propagation from one point to the next therefore combines (1) and (2) xn,i = Kn+1,i xn+1,i to propagate up the column. Plotting the results from developing these solutions creates trajectories on a triangular composition diagram. • These trajectories always move from low boiling mixtures to higher boiling ones. -7- glycol ethanol water min boiling azeotrope -8- There are examples where these trajectories break the triangle into regions. 120 170 160 155 The claim is that one cannot cross these boundaries using distillation columns, at least not by enough to make it useful. It would be impossible therefore to break the minimum boiling azeotrope (155 deg point) with the low boiling component (120 deg component) indicated using ordinary distillation columns. -9- Nodes and saddles In a residue map, the pure component and azeotrope points are of three types: stable nodes, unstable nodes and saddle. All trajectories enter a stable node (it is a local high temperature point), all trajectories leave an unstable node ( it is a local low temperature point), and some trajectories enter while others leave a saddle. In this case there are four distillation regions. Note the nodes and saddles. Why is the ternary azeotrope a saddle? - 10 - One can check if a ternary diagram is topologically legal by using the following formula (Doherty and Perkins, 1975): 4*(N3-S3)+2*(N2-S2)+(N1-S1) = 1 where N3 is the number of ternary azeotropes that are nodes S3 the number that are saddles N2 the number of binary azeotropes that are nodes S2 that are saddles N1 the number of pure component nodes S1 the number of pure component saddles If you create a sketch that violates this equation, the diagram is not legal. For the above examples Ethanol, water, glycol: (4(0-0) + 2*(1-0) + (1-2) = 2-1=1 Next figure: 4(0-0) + 2(0-1) + (3-0) = -2+3 = 1 Last figure: 4(0-1) + 2(1-0) + (3-0) = -4+2+3=1 and all three are topologically legal. Homework: Suppose you have the following data for the pure components and all the binary azeotropes that exist (but none for ternary azeotropes) – pure component BP: A:190, B:200, C:220; binary azeotropes AB:185, BC:195. Assume at most one ternary azeotrope can exist. How many different ways can you sketch a residue curve that would be topologically legal for these temperatures? Prove a ternary azeotrope is not possible? - 11 - Example 2 Separate a mixture of acetone, chloroform and benzene. We shall show how to generate alternative structures systematically for solving this problem. Chloroform Benzene > 99% < 10-4% Acetone > 99.9% Benzene > 99.9% FEED 36 % Acetone 24 % Chloroform 40 % Benzene ? Note we will allow the chloroform to have up to about 1% acetone in it. We will use this higher level of contamination later to our advantage. - 12 - We can show the "binary separation tasks" for this problem as follows. As we suggest separations, we can keep track of which portions of these tasks they accomplish. Acetone Acetone 99.9 % Benzene 99.9 % 99.9 % Feed Feed Feed 1% Chloroform 0.1 % 10-4 % Benzene Chloroform - 13 - First we need to estimate the ideal/nonideal behavior of these species. We can use infinite dilution K-values as follows. (One could also develop T vs x,y plots using a flowsheeting system for each binary pair.) 64 We can predict azeotropic behavior as follows from infinite dilution K-values. These in turn are readily available by performing a small set of flash calculations using any flowsheeting system. 62 60 K AC = yA < 1 xA T [C] K1 2 58 o o y1 γ1 • p1 y2 γ 2 • p 2 = x = p ; K2 1 = x2 = p 1 Max. boiling azeotrope: K1 2 < 1 ∧ K2 1 < 1 56 K CA = Min. boiling azeotrope: K1 2 > 1 ∧ K2 1 > 1 yc < 1 xc Heteroazeotrope: 54 0 Acetone 0.2 0.4 0.6 0.8 1 Chloroform Fig. Liquid and vapor mole fractions vs T at equilibrium for Acetone and Chloroform - 14 - K1 2 > 10 ∧ K2 1 > 10 Applying these ideas to our problem ω Acetone Chloroform Benzene K of ----in Acetone 1.0 0.4 (max) 0.7 (normal) Chloroform 0.6 1.0 0.4 (normal) Benzene 3.0 1.5 1.0 With this information and that for pure component boiling points at the pressure of interest, we can sketch the ternary diagram for this mixture. We can also use a computer code to generate it, which was done for the following figure. We see that there is one maximum boiling azeotrope between Acetone and Chloroform. Two things we can put on this diagram when sketching 1) a distillation boundary exits, which we deduce when attempting to explain the azeotropic behavior determined using infinite dilution K-values. 2) the boundary is curved. This, too, can be predicted by noting that the infinite dilution K-values for Acetone and Chloroform in lots of Benzene indicate that Acetone is more volatile. Therefore, Chloroform acts like an intermediate component in the benzene rich end of the diagram. The residue curves start out aiming at Chloroform from Benzene. - 15 - o 0 1 Benzene 80.1 C 0 .8 0.2 0.6 ne x rm ofo Be nz e lor x Ch 0.4 0 .4 0.6 Feed 1 0 0 .2 0.8 D Acetone o 56.5 C Chloroform 1 0.8 0.4 0.6 x Acetone - 16 - 0.2 0 o 61.2 C If we distill the feed, what products might we expect to be able to produce in the column? We can carry out the following experiment. • Run a column with the given feed. • Use lots of trays top and bottom • Use a large reflux rate • Draw off one drop of top (distillate) product, with the rest drawn off as a bottoms product. The top product will be the extreme we can get from distillation – the composition corresponding to the lowest temperature in this distillation region. That is, it will be pure acetone. The bottoms will be the entire feed. Next draw off 1% of the feed as a top product. It too will be pure acetone, but the bottom product will be the feed less this acetone. Its composition is on a straight line from the acetone through the feed and slightly to the other side. Draw off 2%, 3% etc. Continue until the top product is no longer pure acetone. This will happen when one draws off 31% of the feed as top product. At this point the bottoms product will hit the distillation boundary for the region. Draw off 32% and one will take chloroform with the acetone. As one increases from here one draws off more and more chloroform, and the top product composition moves along the lower edge while the bottoms moves along the distillation boundary. At 60%, the top will be all the acetone and all the chloroform and the bottoms will be all the benzene. If one draws off 61%, one must take some benzene overhead. The bottoms will remain pure benzene, but it will not be all of it. - 17 - The following figure illustrates. Benzene 80.1 oC 1 0 0. 8 Be nz en e x 0. 2 0. 6 0. 4 x Ch lor of or m Feed 0. 4 0. 6 0. 2 0 0. 8 D 1 Acetone o 56.5 C Chloroform 1 0.8 0.6 0.4 x Acetone - 18 - 0.2 0 o 61.2 C Note the “bow tie” shape to this region. A good first approximation to what can be reached is to draw a line from the lowest boiling point through the feed until hitting a distillation region boundary or the edge of the composition triangle. Also draw a line from the highest boiling point through the feed as far as possible while staying within the same distillation region. The “bow tie” region represents a good approximation of what one can reach for products in a column. For nearly ideal components, the picture is as follows: - 19 - - 20 - To see some of the possibilities for benzene, acetone and chloroform, look for interesting products we can reach. They include: o 0 1 Benzene 80.1 C • top product of pure acetone with a bottoms being a mixture of all three species in significant amounts - the direct split • bottom product of pure benzene with a top that is only acetone and chloroform - the indirect split • a bottom product, which is a mixture of benzene and chloroform. The ratio of acetone to chloroform is lower than required for the chloroform product - less that 1% acetone relative to the chloroform. The top is a mixture a acetone and chloroform - an intermediate split Feed 0.8 0.2 Bottom 0.6 Be nz en e x 0.4 0.6 F rm ofo lor x Ch 0.4 indirect split direct split 0.2 0.8 D 1 0 Distillate Acetone o 56.5 C Chloroform 1 0.8 0.4 0.6 0.2 x Acetone - 21 - 0 o 61.2 C We can start with the direct split, which produces nearly pure acetone from the top of the first column. A second column separates benzene (bottoms) from a mixture of acetone and chloroform. The mixture of acetone and chloroform is separated into pure chloroform (top) and the maximum boiling azeotrope (bottoms) between acetone and chloroform. The azeotrope can be mixed with the original feed to complete the flowsheet. - 22 - Benzene 80.1 oC B2 D2 D1 Acetone Acetone 99.9 % F 99.9 % M 1 2 3 B2 B3 Feed F ee d B1 D3 35 % 35 % 23 % 15 % Chloroform p = 1 bar Chloroform Feed open loop converged Intermediate and product compositions open loop B1 F Intermediate and product compositions converged with recycle M en op Acetone o 56.5 C op lo B3 D1 x Acetone - 23 - D2 D 3 Chloroform o 61.2 C The indirect split is not a useful starting point as benzene is needed to separate acetone from chloroform and removing it first is counterproductive. - 24 - Mixing to improve separation: We can propose using mixing to get two interesting products from a single separation - a contradiction. However, it can be done. Propose mixing benzene with the original feed to move the material balance line so it permits acetone as a top product and the benzene/chloroform mixture that has very little acetone as the bottoms. Doing so means we can get a solution to our problem that involves only two columns, as follows. - 25 - Mixing for improved separation D1 F M D2 1 2 0.2 M 0 .8 p = 1 bar 0 1 Benzene 80.1 oC B B1 2 Feed 0 .6 x Be nze n rm of o lo r e x Ch 0. 4 Intermediate and product compositions 0.4 0. 6 F 0 .2 compositions satisfying mixing goal 8 0. Residue curve boundary 0 1.0 % Acetone Acetone D o 56.5 C 1 0.8 0.4 0.6 x Acetone 0.2 D2 Chloroform o 61.2 C The first column produces pure acetone at the top and an nearly acetone free bottoms. The second column separates benzene (bottom) from chloroform. Part of the benzene recycles to shift the feed to the first column. - 26 - Finally, we can start with the intermediate split. In this solution, we separate the feed into a bottom product that has little acetone in it. The bottom is separated into benzene and chloroform. The top is a mixture of acetone and chloroform that we separate in a third column into acetone and the azeotrope between the acetone and chloroform. The azeotrope can again be mixed with the feed. Benzene 80.1 o C B2 D2 1 2 D3 3 B2 B3 Feed F Acetone 56.5 o C D3 xAcetone - 27 - B3 Chloroform D2 o 61.2 C - 28 - Example 3. Breaking a binary azeotrope: You have been given the following binary azeotrope. How would you synthesize a process to break it into pure A and pure B products? You are allowed to use a third species to help. We cannot break it as it is using binary distillation because we cannot get past the azeotrope. The best top product from a column will be arbitrarily close to the binary azeotrope. The best bottom products will be arbitrarily close to either of the stable nodes – pure A if the column is to the left of the binary azeotrope or pure B otherwise. What could be your thought processes to accomplish a separation here? - 29 - How about checking if the pressure has an effect on the composition at which the azeotrope boils? This would be the easiest way to break it. For example, suppose at high pressure the azeotropic composition shifts as shown here. We can quickly sketch a process using this representation. original feed low pressure high pressure high P column low P column First feed the azeotrope to the high pressure column, getting the separation shown here. The two products will be pure left most product and high pressure azeotrope. Feed the high pressure azeotrope to a low pressure column and in that column product pure right most product and low pressure azeotrope. Recycle this low pressure azeotrope back to feed the high pressure column. - 30 - Let’s think of adding a third component. What properties must it have? Any thoughts? - 31 - How about mixing with a third component and using distillation? Suppose we do and choose one that boils below the other two. Then there will be a distillation boundary created with the 305 and 320 points being stable nodes – i.e., the best bottom product in any separation we might propose. The best top product is again the azeotrope, the lowest temperature point in our diagram. 250 K How about if the top temperature is 350 K? Then it becomes the stable node and converts the previous two to saddles. They can never be products in any column. Okay, what might you try next? 305 K 320 K 300 K - 32 - What if you convert one of the stable nodes to an intermediate one? We can do this by choosing the third component to be one that boils between the other two. No distillation boundary results. Do you agree? Now we can mix the azeotrope we are trying to break so we can feed a column that can have the stable node as the bottom product and the left edge as the top product. A second column will recover the third component and - 33 - the component that boils at 305 K in as pure a form as desired. This is a general way to think about breaking a binary azeotrope. - 34 - Are there any other “general” approaches to break a binary azeotrope? How about adding a low boiling third component that gives us a very curved boundary? This is suggested by the acetone, chloroform, benzene example. As here we have a min boiling azeotrope, the other species must boil at a lower temperature. It will create a distillation boundary – something we just suggested we wanted to avoid. But do we really need to? How do we assure ourselves of a curved boundary? We need a third component that has very different infinite dilution Kvalues with the two original species. Thus in lots of the third component, the 320 K component should be a lot less volatile (have a low K value) relative to the 305 K component – or vice versa. - 35 - And yet another way to think about this problem – use extractive distillation. In this case we feed the column with a second feed, generally with a heavy component above the azeotrope feed. An example is to separate water (W) from isopropylalcohol (IPA) using ethylene glycol (EG). In lots of ethylene glycol, water is an intermediate component and IPA a light. We operate to have lots EG in most of the column by feeding it near the top of the column. It is heavy and will be on all trays below its feed, leaving at the bottom. The residue curves for these three species for a ternary diagram are as shown to the right here. - 36 - Note, to the right of the a-b line, where lots of EG is present, the residue curves give one the impression that EG is the heavy component, water the intermediate and IPA the light. In the bottom of this column, below the feed, one is separating the IPA from the water. The water makes it to the bottom product but not the IPA. Above the azeotrope feed, one is separating the water from the IPA, with the IPA making it to the EG feed but not the water. Above the EG feed, we simply separate the very heavy EG from IPA in one or two trays, as all the water is gone by this point. - 37 - And yet another thought on this. How about using liquid-liquid behavior if it is available? Suppose we have the pyridine, toluene azeotrope to break. We can do it using water. Add water until the mixture allows a column to separate pyridine from the azeotrope between toluene and water on the lower edge. Then decant the toluene from the water. - 38 - So then, what should you look for in a solvent to break a minimum boiling azeotrope? • If the solvent is lighter than the other two, look for a very curved distillation boundary – you will get a boundary. • If the two original species boil at quite different temperatures, look for a solvent that boils between. • If you can find a suitable heavy solvent, think to use extractive distillation. • If a solvent yields favorable liquid/liquid behavior, consider using it as illustrated for breaking the toluene/pyridine azeotrope. By analogy, you should be able to invent the rules to break a maximum boiling azeotrope. Total symmetry is not possible, however, as a three component liquid/liquid region that starts at a binary edge always has a binary minimum boiling azeotrope in it. - 39 - Example 3: A tough four component separations problem Pentane > FEED 75.11 % 12.13 % 11.34 % 1.42 % ? Acetone > Methanol > Water > This one is tough because it was deliberately constructed to have species that “hate” each other. They form all sorts of azeotropes. Also we see water and pentane, which almost certainly will form two liquid phases. Finally, the feed is the hydrocarbon rich phase of doing a decantation of an equal molar mixture of the four species. So decanting it to get started has already been done. - 40 - Alternative separation options Let’s examine K-values and activity coefficients at infinite dilution a drop of in lots of pentane acetone methanol water pentane acetone methanol water K=1 γ=1 7.9 4.7 29.6 14.4 8106 3213 3 (min) 6.6 1 1 2.4 2.0 38.5 11.5 5.9 (min) 23.1 1.3 2 1 1 7.8 2.2 71.4 (het) 1537 1.05 (min) 7.4 0.4 (ok) 1.6 1 1 First, why not distillation? There are a lot of azeotropes. Then how about extractive distillation using water? Acetone and methanol have very different K-values (38.5 and 7.8) in water and would seem to be separable? Also both are much lighter (K-values much larger than unity) than water. But water will break into a separate liquid phase if added. So then, how about liquid-liquid extraction? - 41 - Equilibrium for liquid-liquid extraction. Equate fugacities of a component i in two liquid phases I and II xI[i]γI[i]fIo[i]= xII[i]γII[i]fIIo[i] ! xI[i]γI[i] = xII[i]γII[i] " xI[i]/ xII[i] = γII[i]/γI[i] as the pure component i fugacity at T and P, fIo[i] = fIIo[i]. We define a separation factor between two species i and j as their mole fraction ratios in the two phases. SI/II[i,j] = (xI[i]/ xII[i])/ (xI[j]/ xII[j]) = (γII[i]/γI[i])/( γII[j]/γI[j]), which we can evaluate at infinite dilution in the phases I and II. We assume I = n-pentane and II = water are the major components in the two phases and estimate the following limiting separation factor for how methanol and pentane will split between these two phases: Swater/pentane[methanol, pentane] = (23.1/2.2)/(1.0/3213) = 33,740, which is a large separation factor. In other words methanol likes water a lot more than it likes pentane and will go largely into the water phase. Swater/pentane[acetone, pentane] = (6.6/11.5)/(1.0/3213) = 1850, which says acetone also much prefers water but not as much as methanol prefers water to pentane. - 42 - We propose as a first separation device, liquid-liquid extraction. Analyzing using Aspen gives: F11 P 17.4168 A 1.0054 W 0.023 W 3.3 P A M W EX-1 : : : : Pentane Acetone Methanol Water F0 F12 P 17.7827 A 2.8729 M 2.6842 W 0.3354 W 3.6124 M 2.6842 A 1.8675 P 0.3659 The n-pentane rich product F11 has essentially no methanol and very little water. - 43 - This unit also took a large part of the acetone out with the water, leaving a pentane rich phase with little of acetone and a water rich one with a mot of it. Distilling the pentane-rich phase lets us obtain a bottom product which is essentially pure n-pentane and a top which is the pentane/acetone azeotrope. P 3.3092 A 1.0052 W 0.023 F11 P 17.4168 A 1.0054 W 0.023 n-pentane/acetone azeotrope F21 DI-2 99.999 % F22 P 14.1076 A 0.0002 pure n-pentane Distilling the bottom product gives us again the azeotrope as the top product but this time we get all the water out the bottom. It has both acetone and methanol in it. We recycle the azeotropes back to the liquid/liquid extraction unit. - 44 - We now have a mixture of methanol, acetone and water to separate, and methanol and acetone form a min boiling azeotrope. Water and methanol on the other hand do not. In lots of water, methanol is the intermediate (K-value of 7.8) and acetone the light (K value of 38.5). We can easily use extractive distillation with water to separate acetone from methanol, getting acetone out the top of the column and methanol with the water out the bottom. The last step is to distill to separate the methanol and water. The final flowsheet is as follows. - 45 - - 46 -
