Dr Pepper Snapple Group, Inc. - University of Oregon Investment
advertisement
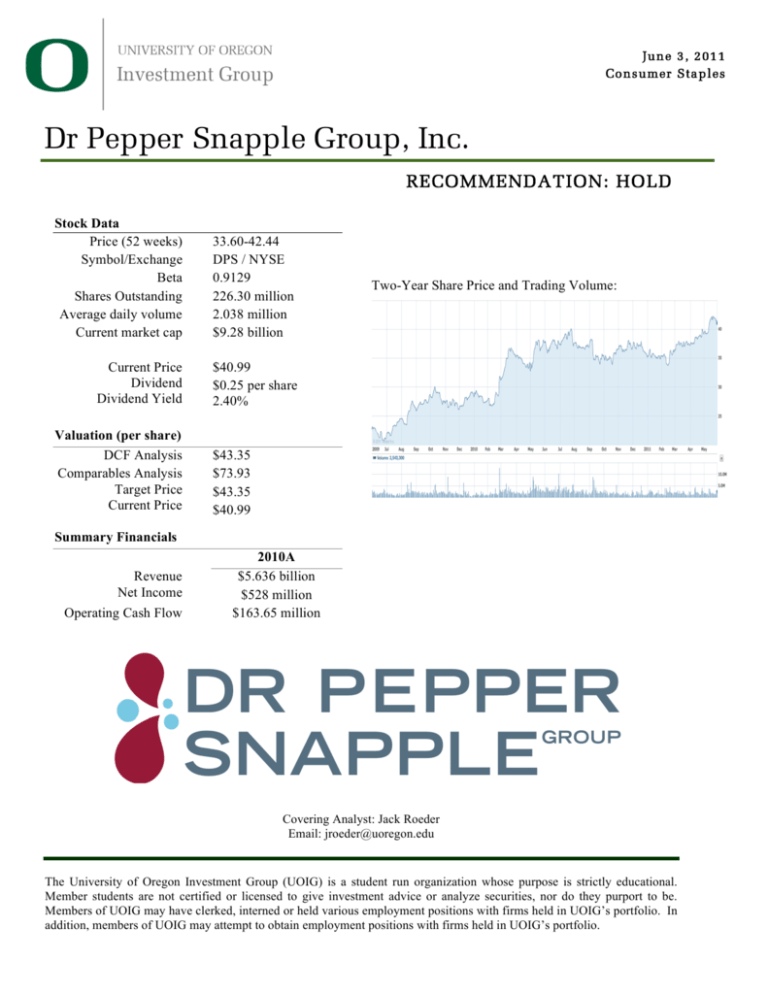
June 3 , 2 01 1 Co nsumer Sta ples ! ! Dr Pepper Snapple Group, Inc. ! RECOMMENDATION: HOLD !! Stock Data Price (52 weeks) Symbol/Exchange ! Beta ! Shares Outstanding Average daily volume ! Current market cap ! ! ! Current Price Dividend Dividend Yield 33.60-42.44 DPS / NYSE 0.9129 226.30 million 2.038 million $9.28 billion Two-Year Share Price and Trading Volume: $40.99 $0.25 per share 2.40% ! Valuation (per share) ! DCF Analysis Comparables Analysis ! Target Price Current Price ! Summary Financials ! Revenue Net Income Operating Cash Flow $43.35 $73.93 $43.35 $40.99 ! 2010A $5.636 billion $528 million $163.65 million ! ! ! ! ! Covering Analyst: Jack Roeder Email: jroeder@uoregon.edu The University of Oregon Investment Group (UOIG) is a student run organization whose purpose is strictly educational. Member students are not certified or licensed to give investment advice or analyze securities, nor do they purport to be. Members of UOIG may have clerked, interned or held various employment positions with firms held in UOIG’s portfolio. In addition, members of UOIG may attempt to obtain employment positions with firms held in UOIG’s portfolio. ! Dr Pepper Snapple Group, Inc. University of Oregon Investment Group http://uoig.uoregon.edu BUSINESS OVERVIEW Dr Pepper Snapple Group, Inc. (DPS) is an integrated beverage brand owner, manufacturer, and distributor of non-alcoholic beverages in the U.S. (89% of sales), Canada (4% of sales), and Mexico and the Caribbean (7% of sales). DPS was spun off from Cadbury Schweppes on May 5, 2008, and began trading on the NYSE on May 7, 2008. Headquartered in Plano, Texas, Dr Pepper Snapple Group, Inc. is a leading provider of flavored carbonated soft drinks (CSDs) and non-carbonated beverages (NCBs). They have built their success through strategically acquiring beverage brands and then building them into leaders in their category. Examples of these key brands include: ! ! ! ! ! ! ! ! ! ! ! ! ! ! ! ! The firm’s operations are divided into three key segments: Beverage Concentrates, Packaged Beverages, and Latin America Beverages. Beverage Concentrates – 21.12% of 2010 revenue ($1.2 billion) The Beverage Concentrates segment is generally operated as a brand ownership business. After manufacture, beverage concentrates are shipped to first and third party bottlers and distributors, where they are combined with carbonation, water, sweeteners, and other ingredients. They are then bottled in plastic or aluminum and shipped to retailers. Beverage concentrates can also be manufactured into syrup, which is sold to fountain customers who mix the syrup with carbonated water to produce a finished beverage. PepsiCo and Coca-Cola are the largest customers of the Beverage Concentrates segment, representing 30% and 21% of the segment’s net sales in 2010, respectively. Historical Performance: Net Sales Segment Operating Profit Segments Operating Margin 2008 983 622 63.28% 2009 1,063 683 64.25% 2010 1,156 745 64.45% Packaged Beverages – 72.16% of 2010 revenues ($4.1 billion) The Packaged Beverages segment manufactures finished beverages from beverage concentrates and distributes them across the U.S. and Canada. This segment manufactures both first and third party brands and distributes them through first party channels or third party distributors. Final retail locations include supermarkets, mass merchandisers, vending machines, convenience stores, gas stations, and grocery stores. Due to bottling and distribution, this segment is sensitive to changes in aluminum, plastic, and oil prices. Historical Performance: Net Sales Segment Operating Profit Segments Operating Margin 2008 4,305 483 11.22% 2009 4,111 573 13.94% 2010 4,098 536 13.08% 2 ! Dr Pepper Snapple Group, Inc. University of Oregon Investment Group http://uoig.uoregon.edu Latin America Beverages – 6.72% of 2010 revenues ($382 million) The Latin America Beverages segment has similar functions to the Beverage Concentrates and Packaged Beverages segments with operations focused in Mexico and the Caribbean. This includes the manufacture, bottling, and distribution of first and third party beverage brands. Key brands in this segment include Peñafiel, Squirt, and Clamato. Low operating profit in 2010 is largely due to considerable investments in information technology infrastructure and marketing. Historical Performance: Net Sales Segment Operating Profit Segments Operating Margin 2008 422 86 20.38% 2009 357 54 15.13% 2010 382 40 10.47% BUSINESS AND GROWTH STRATEGIES Dr Pepper Snapple Group, Inc. outlines six key elements to their overall business strategy: • Build and enhance leading brands – DPS spends a great deal of time identifying the brands that have the greatest potential for profitable growth, and then invests heavily in innovating and developing these brands to match consumer preferences. • Focus on opportunities in high growth and high margin categories – The most recent trend in the liquid refreshment beverage (LRB) industry is the emergence of alternative beverages such as flavored waters and energy drinks. These beverages tend to be healthier than traditional soft drinks and/or provide a functional benefit such as caffeine or taurine. • Increase presence in high margin channels and packages – High margin retail locations include convenience stores, vending machines, and independent retail outlets. Volume in these channels is expected to grow as the economy recovers, consumer confidence increases, and people have more discretionary income. DPS is taking advantage of this by investing in branded coolers and other cold drink equipment specific to their well-known brands. High margin packages tend to be smaller serving sizes and single-serve packages, which DPS plans to increase demand for through heavy promotional activity. • Leverage our integrated business model – The LRB industry experiences strong benefits from economies of scope and through vertical integration. Dr Pepper Snapple’s brands cover a wide variety of beverage segments, and their integrated business model allows them to align the economic goals of their business as a whole. • Strengthen our route-to-market – Recently, this has involved heavy investments in information technology infrastructure, especially in Mexico and the Caribbean. Additionally, DPS has developed systems for third party bottlers and distributors to help maintain priority for their brands in other companies’ systems. • Improve operating efficiency – The major component of this strategy is Dr Pepper Snapple’s recent Rapid Continuous Improvement (RCI) initiative that they began in 2010. This initiative involves the development of Lean business practices and Six Sigma efficiencies throughout the company. The majority of the company’s focus seems to be on building and enhancing their leading brands and improving operating efficiency. As the US economy recovers from the recession and people have more discretionary income, they will begin returning to the brands they are familiar with and loyal to. DPS plans to take advantage of this through heavy advertising and investments in current brands and product lines. For example, they plan to launch the new beverage Dr Pepper 10, a low calorie soft drink for men, nationwide in 2011. Additionally, after DPS was spun off from Cadbury Schweppes in 2008, management’s focus was on transitioning into a standalone beverage 3 ! Dr Pepper Snapple Group, Inc. University of Oregon Investment Group http://uoig.uoregon.edu business. Now that the transition is largely complete, management can focus more time and resources toward improving Dr Pepper Snapple’s operations. This is evident in their recent RCI initiative, which has already produced promising results. One major concern with DPS’s growth strategy is their lack of focus on the alternative and functional beverage markets. These markets have seen strong growth as consumer preferences shift away from unhealthy CSDs toward healthier options. However, DPS continues to focus the majority of their resources on existing and new carbonated soft drinks. In fact, during their 2010 annual earnings call, when asked whether or not DPS plans to participate more actively in non-carbonated beverage categories, President and CEO Larry Young responded: “No, we’re still very happy with our portfolio… we stay focused on the total portfolio, but we are putting a lot of emphasis right now on our carbonated soft drinks. As I mentioned a moment ago, I think with the tough economic times we’re going to see people come back in and recognize that value. That’s where we’re putting a strong focus.” I feel that this lack of consideration for the strength of emerging product categories will be a missed growth opportunity for Dr Pepper Snapple going forward. Finally, a key point to note is Dr Pepper Snapple’s relatively low international exposure. They currently only operate in the US, Canada, and Mexico and the Caribbean. This presents a significant growth opportunity into international markets. However, since DPS has not indicated any intention of international expansion, I did not consider it in my quantitative valuations. MANAGEMENT AND EMPLOYEE RELATIONS Larry D, Young – President and CEO 2007-Present Martin M. Ellen!"!CFO 2010-Present Larry Young was appointed to CEO and President of DPS in 2007 after leading the spinoff from Cadbury Schweppes. He has approximately 30 years of experience in the beverage industry, beginning as a worker on a route truck and working his way up. His 30-year career includes 25 years in the PepsiCo family of businesses. Including his role as CEO of DPS, he also serves on the company’s Board of Directors. Martin Ellen has over 25 years of broad experience as a financial officer in a wide variety of industries. Before joining DPS, Martin Ellen was the CFO at Whitman Corporation, which then owned Pepsi Cola General Bottlers, Inc. He is not on the company’s Board of Directors 4 ! Dr Pepper Snapple Group, Inc. University of Oregon Investment Group http://uoig.uoregon.edu PORTFOLIO HISTORY • • Tall Firs: o Purchased 600 shares on 10/8/2009 at a cost basis of $17,580. This holding is currently worth $24,864, representing a return of 41.43%. Svigals’: o Purchased 68 shares on 10/2/2009 at a cost basis of $1,926.43. This holding is currently worth $2,792.08, representing a return of 44.94%. RECENT NEWS April 27, 2011 – Dr Pepper beats, keeps view despite cost spikes (Reuters.com) DPS beat earnings earnings estimates for Q1 2011. However, they did not increase their outlook for the rest of the year. Some analysts interpret this as a sign of slower growth going forward. However, others viewed it as a sign of strength as commodity prices are expected to rise significantly in the coming years. April 29, 2011 – Consumer Sentiment in U.S. Increased in April on Jobs (Bloomberg.com) Signs of job growth are finally starting to boost consumer confidence. With more jobs and recovering consumer sentiment, firms whose sales depend on discretionary purchases, such as DPS, are expected to benefit. May 11, 2011 – Dr Pepper Snapple Group Stock Hits New 52-Week High (TheStreet.com) As of May 11, 2011, DPS began trading at a new 52-week high, and has recently begun trading at an all-time high around $42 per share. These figures have been seen as both attractive and troublesome to different investors. May 16, 2011 - Dr Pepper files trademarks for more low-cal sodas (MarketWatch.com) Following the success of Dr Pepper 10 in its test markets earlier this year, Dr Pepper has filed trademarks for Canada Dry 10, Seven Up 10, and A&W 10. DPS has not stated any definite plans to launch these products, but this signals their intention to compete more heavily in the healthier, lower calorie drink markets. INDUSTRY The liquid refreshment beverage (LRB) industry as a whole is experiencing growth that is mostly in line with the growth of the economy. Since DPS has product offerings in most of the categories within the LRB industry, a breakdown by sub-industry is helpful. Syrup & Flavoring Production The syrup and flavoring production industry is a roughly $6.5 billion per year industry. It includes companies that produce and sell beverage concentrates that are eventually used in the production of bottled beverages or fountain drinks. This industry is clearly at the end of its maturity stage and entering the decline stage as revenue is growing slower than the economy. As consumer preferences shift toward healthier alternatives, industry players have been required to adapt their product offerings. Profitability in this industry is highly dependent on sugar and corn prices, as these comprise a huge majority of input costs. Sugar and corn prices are expected to increase in the coming years and place pressure on margins. Consequently, firms with 5 ! ! Dr Pepper Snapple Group, Inc. University of Oregon Investment Group http://uoig.uoregon.edu strong brand names and pricing power will be able to manage their margins and maintain profitability. Since syrups and concentrates have to be turned into finished beverages before being sold to the end consumer, the demand for this industry is dependent on the demand for carbonated soft drinks, juices, and other beverages. As a result, the syrup and flavoring production industry has seen an overall decline of around 5.5% in the last five years due to lower levels of discretionary income and shifts in consumer tastes away from unhealthy beverages. It is expected that the industry will grow slowly over the next five years as discretionary income recovers with the economy and alternative and functional beverages grow. Carbonated Soft Drink Production The carbonated soft drink consumption industry is a roughly $17.0 billion per year industry. It includes firms that turn syrups and concentrates into finished beverages, bottle them, and then distribute them for resale. Like the syrup and flavoring production industry, this industry is entering its decline stage, as consumers prefer healthier alternatives. Over the past five years, the industry has declined roughly 7.1%, and the industry is expected to decline roughly 2.0% per year over the next five years. The key driver of this industry is per capita soft drink consumption, which has declined consistently over the past decade, and is projected to continue declining in the future. Although the industry is expected to decline, it is highly concentrated with key players who will likely be able to maintain profitability through their strong brand offerings and pricing power. These major players are able to make strategic acquisitions of alternative beverage brands that they can sell at a premium. The major players in this industry are Coca-Cola (43.7%), PepsiCo (35.4%), and Dr Pepper Snapple (15.0%). ! Vertical integration is a key trend in this industry. Both The Coca-Cola Company and PepsiCo, Inc. have acquired all or a majority share of their respective bottling and distribution companies. This trend is a result of pressured margins and the goal of integrated beverage firms to operate their entire supply chain as profitably as possible. Fruit Juice and Functional Beverage Production The fruit juice and functional beverage production industry is a roughly $27.0 billion per year industry and includes fruit juice, functional drinks, ready-to-drink coffee and teas, and flavored water manufacturers. This industry has experienced impressive growth over the past five years, and is expected to continue growing but at a slower rate going forward. This growth is largely driven by increased health consciousness and busier lifestyles that benefit from functional beverages. 6 ! Dr Pepper Snapple Group, Inc. University of Oregon Investment Group http://uoig.uoregon.edu PepsiCo, Inc., The Coca-Cola Company, and Dr Pepper Snapple Group, Inc. are the major players in this industry with market shares of 35.0%, 18.5%, and 6.4%, respectively. This market concentration grants these firms strong brand recognition and pricing power. Similar to the carbonated soft drink industry, the success of the fruit juice and functional beverage industry is largely dependent on discretionary income. As consumer sentiment increases, this industry is likely to experience growth. However, it is possible that consumer curiosity concerning functional beverages has been exhausted. This suggests that people will begin turning toward the brands they are most familiar with, placing much greater importance on individual brand advertising in this industry. As an integrated beverage company, Dr Pepper Snapple must face the changing landscape of the liquid refreshment beverage industry. Consumer preference and income drive this industry. Consequently, increasing disposable income and a greater demand for healthy and functional beverages present DPS with considerable opportunities going forward. S.W.O.T. ANALYSIS • • • • • • • • Strengths Strong, recognizable beverage brands in a number of markets (most brands are #1 or #2 in their product category) Management team with a wealth of experience in the LRB industry Separation from Cadbury Schweppes allows continued ability to focus resources on their beverage business Strong relationships with key customers Integrated business model allows for alignment of company goals at multiple levels of operations Opportunities Increasingly health conscious consumers demand alternative and functional beverage options The recovering economy suggests people with have more discretionary income, leading to more impulse purchases at convenience store and grocery outlets Relatively limited international presence leaves room for considerable expansion abroad • • • • • Weaknesses Continued focus on carbonated soft drinks rather than alternative and functional beverages Considerably smaller in size than their two major competitors Coca-Cola and PepsiCo Lack of international exposure Threats Margins could be hurt by rising and volatile commodity prices Unforeseen changes in consumer preferences PORTER’S 5 FORCES ANALYSIS Supplier Power - High Supplier power for Dr Pepper Snapple is high. Almost all of Dr Pepper Snapple’s inputs are commodities such as sugar, corn, PET, fuel, aluminum, apple juice concentrate, and natural gas. As a result, DPS has very little power 7 ! Dr Pepper Snapple Group, Inc. University of Oregon Investment Group http://uoig.uoregon.edu in affecting the prices they pay for these commodities. They do have some hedges in place to protect against large fluctuations in commodity markets, but they still have little control over the prices they ultimately end up paying. Barriers to Entry - High Barriers to entry are relatively high since brand recognition is incredibly important. Additionally, larger firms experience significant benefits from economies of scope and scale, making it difficult for new entrants to match their operational efficiencies. Independent brands are able to find success in niche and local markets. Buyer Power – Low to Medium Depending on their buyer, buyer power can range from low to medium. The Coca-Cola Company and PepsiCo, Inc. represent roughly 50% of Dr Pepper Snapple’s beverage concentrates segment and are considerably larger in size than DPS. However, these relationships are contractual so few changes can be made. Beyond this, other buyers of Dr Pepper Snapple’s products have low power because they represent a small fraction of Dr Pepper Snapple’s sales and Dr Pepper Snapple’s strong brand names grant them pricing power in most markets. Threat of Substitutes – Medium to High The threat of substitutes is medium to high. Consumers that are health conscious or with preferences that are not met by Dr Pepper Snapple’s product offerings may seek to fill their beverage needs elsewhere since switching costs are incredibly low. However, since integrated beverage producers experience large benefits from economies of scope, all major players in the industry offer a very wide range of beverage options. Degree of Rivalry – Very High With only three major players in the integrated beverage industry, the degree of rivalry is very high. The CocaCola Company, PepsiCo, Inc., and The Dr Pepper Snapple Group, Inc. all offer products in every major nonalcoholic beverage category that directly compete with one another. They offer superior brands with pricing power that have developed loyal customers. Since brand loyalty plays such an important role in this industry, major players compete on brand image rather than price, making marketing and advertising very important aspects of these three companies. COMPARABLES ANALYSIS In conducting a comparables analysis for Dr Pepper Snapple Group, I focused on companies in the liquid refreshment beverage industry that had operations in manufacturing, bottling, and distribution. It was difficult to find companies with the same combination of strong brands, diversified product offerings, relatively small size, and integrated business model as Dr Pepper Snapple, so I chose companies that balanced these elements. Ultimately, I placed a greater weight on a diversified portfolio of strong brands because this is Dr Pepper Snapple’s key strength and the growth element that they stress the most. The multiples I chose to use are EV/Revenue, EV/Gross Profit, EV/EBITDA, EV/(EBITDA-CapEx) because they provide an overall picture of how well a firm can generate revenue, manage margins, and generate sustainable cash flow without worrying about differences in accounting standards. The Coca-Cola Company (KO) – 35% The Coca-Cola Company (KO) is the world’s largest non-alcoholic beverage company. Key brands include Coca-Cola, Diet Coke, Sprite, Fanta, and Mr. Pibb. In October of 2010, KO acquired the US operations of their main bottler and distributor, Coca-Cola Enterprises, Inc. (CCE) in order to maximize the efficiency of their ! operations as a whole. Additional brands and companies that KO has 8 ! Dr Pepper Snapple Group, Inc. University of Oregon Investment Group http://uoig.uoregon.edu acquired include Glaceau (makers of Vitamin Water and SmartWater), FUZE, Dasani, Powerade, Honest Teas, and Full Throttle. I chose to weight The Coca-Cola Company at 35% because they are the nearest company to being a pure-play competitor with Dr Pepper Snapple. They have very strong brands in all major non-alcoholic beverage category, they focus on expanding their existing brands whenever possible, and look to acquire alternative beverage brands in order to compete in those markets and achieve greater economics of scope. Additionally, DPS has a distribution agreement with KO, meaning that KO distributes some Dr Pepper Snapple brands throughout the US and Canada. The key differences between The Coca-Cola company and Dr Pepper Snapple are that they are much larger in size and they have much more international exposure. PepsiCo, Inc. (PEP) – 35% Similar to The Coca-Cola Company, PepsiCo, Inc. is a world leader in branding, manufacturing, bottling, and distributing non-alcoholic beverages around the world. Key brands include Pepsi, Diet Pepsi, Mountain Dew, and Sierra Mist. PepsiCo, Inc. also acquired their two ! main bottlers and distributors the Pepsi Bottling Group (PGB) and PepsiAmericas (PAS) in order to strengthen their supply chain and streamline their route to market. Additional brands and acquisitions include Aquafina, Gatorade, and Tropicana. I chose to weight PepsiCo, Inc. at 35% because they compete with Dr Pepper Snapple in ever major non-alcoholic beverage segment with strong brands and their beverage operations have a closer size to DPS than KO’s. In spite of this similarity in size for beverage operations, PepsiCo, Inc. also operates heavily in the lower margin snack food market with their Quaker and FritoLay brands, in which DPS has no presence. Hansen Natural Corporation (HANS) – 20% Hansen Natural Corporation (HANS) markets, sells, and distributes “alternative” beverages in a number of beverage categories. These brands include Hansen’s Natural Sodas, Hansen’s Fruit Juices, Monster Energy Drinks, Java Monster, and Peace Teas. I chose to weight Hansen Natural Corporation at 20% because they are a smaller sized beverage brand owner, they have limited international ! exposure, and they strongly represent the growth opportunities in alternative beverages. They are not weighted more because they do not have the same brand recognition in carbonated soft drinks and they are not as heavily integrated as Dr Pepper Snapple. National Beverage Corp. (FIZZ) – 10% National Beverage Corp. is an integrated developer, manufacturer, marketer, and distributor a wide variety of non-alcoholic beverage products throughout the United States. Their two key brands are the Shasta and Faygo soda brands, which they offer in over 50 flavor varieties. Additional beverage brands include Everfresh, LaCroix, Crystal Bay, and ClearFruit. I chose to weight FIZZ at 10% because they have similar geographic distribution and they are also an integrated non-alcoholic beverage provider. ! ! 9 Dr Pepper Snapple Group, Inc. University of Oregon Investment Group http://uoig.uoregon.edu However, they are much smaller in size and scope than DPS and have much weaker brand strength. My comparables analysis resulted in a large undervaluation. It is unclear exactly what is causing this price discrepancy, but it is possibly due to the huge acquisitions made The Coca-Cola Company and PepsiCo, Inc. in 2010 that drastically changed the structure of these two firms. Additionally, it is difficult to make an accurate comparables analysis in this industry due to the extremely high market concentration. It would be impossible to do a comparables analysis of Dr Pepper Snapple, Inc. without including KO and PEP, but they are fundamentally different firms in size, scope, product offerings, growth opportunities, and global exposure. Hansen’s and National Beverage Corp. have similar geographic coverage to Dr Pepper Snapple, but they do not have the same level of brand equity and product offerings. As a result, I decided to weight my comparables analysis at 0% in my final valuation for Dr Pepper Snapple, Inc. DISCOUNTED CASH FLOW ANALYSIS Revenue Looking forward, I see DPS growing their revenue through a combination of greater sales volume and price increases. This will largely be a function of growing consumer confidence and greater discretionary income. As a result, I see DPS growing in line with management guidance of around 3-5% for 2011. I stayed on the conservative end of estimates because price increases from earlier in the year are not likely to continue increasing, and planned product rollouts have unproven results. Beyond 2011, I trended revenue growth down because I feel that Dr Pepper Snapple’s continued focus on carbonated soft drinks and North American markets will cause them to suffer lower levels of growth. Beverage Concentrates The beverage concentrates segment’s performance directly depends on downstream demand from the packaged beverage segments. However, I project stronger growth from this segment because of its exposure to fountain beverages. As the economy recovers, consumers not only spend more discretionary income at grocers and convenience stores, but at restaurants, as well. This will lead to increased growth in this segment. I then project this segment’s revenue to trend downward because of Dr Pepper Snapple’s focus on unhealthy soft drinks and lack of international expansion. Packaged Beverages Increased consumer confidence and discretionary income will lead them to make more purchases at convenience stores, grocery stores, and vending machines. This will greatly help this segment. However, again, DPS’s focus on unhealthy beverages will dampen this segments growth in the longer term. As a result, I project conservative growth for this segment that slowly trends downward. Latin America Beverages Although the Latin America segment experienced declining revenue from 2008 to 2009, a solid first quarter in 2011, successful information technology investments, and strong plans for advertising to the Latin American market led me to project growth in this segment for 2011. I then trended this growth downward over the next 10 year in line with my other revenue projections. Cost of Revenue For Dr Pepper Snapple, cost of revenue is almost entirely comprised of PET, diesel fuel, corn (for high fructose corn syrup), aluminum, sucrose, and natural gas. Prices for these inputs are largely determined by commodities markets and are greatly affected by changes in energy and oil prices. Since prices for oil and energy are expected to rise in future years, I projected that cost of revenue will increase nominally every year. Management guidance predicts cost of revenue will increase between 6 and 7% for year end 2011. I trended cost of revenue up as a 10 ! Dr Pepper Snapple Group, Inc. University of Oregon Investment Group http://uoig.uoregon.edu percent of revenue through 2014 and then trended it downward to slightly above historic levels because Dr Pepper Snapple’s pricing power will allow them to manage their gross margin going forward. Selling, General & Administrative Expenses I project that SG&A will decrease as a percent of revenue through 2013 because management’s recent Rapid Continuous Improvement (RCI) initiative to become more operationally efficient has been successful recently. I project that this will allow them to decrease SG&A as a percent of revenue to levels below historical averages. However, management has stated that benefits received from the RCI initiative will be used on increased marketing for their key brands. As a result, SG&A only decreases as a percent of revenue to slightly less than historical averages (35%) and then flattens out through the terminal year. Depreciation and Amortization I kept depreciation and amortization constant as a percent of revenue at 2.25%. This is in line with historical values and I do not predict any major changes going forward. Tax Rate Management guidance predicted a tax rate of around 35% for the rest of 2011. Since this rate is consistent with previous tax rates, I kept the tax rate at 35% through the terminal year. Net Working Capital Since Dr Pepper Snapple is an established firm with a large quantity of similar customers and suppliers, I decided to keep accounts receivable as a constant percent of revenues and accounts payable as constant percent of cost of revenues in line with previous years. DPS received a large cash payment from their recent licensing deals with The Coca-Cola Company and PepsiCo, Inc. I decided to trend this cash amount down toward normal levels until 2017. Capital Expenditures Management expects to incur annual capital expenditures around 4.5% of revenues on purchases of replacement equipment, system upgrades, and expansions to the distribution fleet. Acquisitions Acquisitions allow firms in the beverage industry to maintain revenue growth through the addition of new brands to a firm’s portfolio and extended geographic distribution coverage. Since management has not explicitly stated any plans to make an acquisition in the near future and has stressed their focus on current brands, I did not project any acquisitions in the next three years. However, I do project that Dr Pepper Snapple will make two acquisitions within the next ten years. To consider this in my valuation, I looked at the medium-sized acquisition of FUZE Healthy Infusions by The Coca-Cola Company in 2007, which was approximately $225 million. I multiplied this value by two, and then divided that amount between the years of 2014E through 2020E, with the later years weighted heavier because I believe that DPS has a greater probability of making acquisitions in later years. In the terminal year, I dropped acquisitions down to $20 million to represent a rate of one acquisition every ten years. Beta I ran a three-year monthly regression against the S&P 500 and got a beta of 0.9129. I also ran a three-year weekly, two-year monthly, and two-year weekly, which all resulted in very different betas. I ultimately decided to use the beta from the three-year monthly because it took into account the entire period that DPS has been a publicly traded company and because this beta is most in line with other estimates. I found a Hamada beta, but in accordance with my lack of confidence in the comparability of DPS directly with other companies in the industry, I decided that this beta did not accurately represent the risk of DPS going forward. Consequently, I decided that a beta of 0.9129 best represented Dr Pepper Snapple’s risk and growth going forward. 11 ! Dr Pepper Snapple Group, Inc. University of Oregon Investment Group http://uoig.uoregon.edu Cost of Debt Dr Pepper Snapple has six sets of unsecured notes with six different interest rates. Two of these sets of notes were issued recently and come due soon with very low interest rates. As a result, the debt that is due farther in the future is a better representation of Dr Pepper Snapple’s cost of debt. To calculate the cost of debt, I took a weighted average of the three sets of unsecured notes that mature in 2016, 2018, and 2038. This gave me a cost of debt of 5.59%. RECOMMENDATION Dr Pepper Snapple, Inc. is in a strong position to benefit from the recovering economy and improved consumer sentiment. With a portfolio of powerful brand names, strong marketing, and focused management, DPS is going to see revenue grow and operations become more efficient. However, their continued focus on carbonated soft drinks could limit their growth as alternative and functional beverages gain popularity over unhealthy sodas. Recently, Dr Pepper Snapple has been issuing larger dividends, repurchasing shares, and writing off debt. These are all signs of a successful, stable firm with strong cash flows. For my quantitative valuation, I decided to weight my comparables analysis at 0% and my discounted cash flow at 100%. For the reasons stated earlier in the report, Dr Pepper Snapple’s comparable companies do not convey an accurate valuation of the firm. My discounted cash flows resulted in a small undervaluation. Ultimately, Dr Pepper Snapple’s integrated business model and strong brand portfolio, when coupled with the recovering economy, suggest that there is still value in this company. I recommend a HOLD for both the Tall Firs and Svigals’ portfolios. Method Weighting Implied Price DCF 100% $43.57 Comparables 0% $73.93 Target Price Current Price Undervalued $43.57 $40.99 6.30% 12 ! Dr Pepper Snapple Group, Inc. University of Oregon Investment Group http://uoig.uoregon.edu APPENDIX 2 – DISCOUNTED CASH FLOWS ANALYSIS ! 14 ! Dr Pepper Snapple Group, Inc. University of Oregon Investment Group http://uoig.uoregon.edu APPENDIX 3 – REVENUE MODEL ! APPENDIX 4 – NET WORKING CAPITAL ! 15 ! Dr Pepper Snapple Group, Inc. University of Oregon Investment Group http://uoig.uoregon.edu APPENDIX 5 – DISCOUNTED CASH FLOWS ANALYSIS ASSUMPTIONS Assumptions for Discounted Free Cash Flows Model Tax Rate 35.00% Terminal Growth Rate Risk-Free Rate 3.06% Terminal Value Beta 0.9129 PV of Terminal Value Market Risk Premium 7.00% Sum of PV Free Cash Flows % Equity 78.21% Firm Value % Debt 21.79% LT Debt Cost of Debt 5.59% Cash CAPM 9.45% Equity Value WACC 8.19% Diluted Share Count Implied Price Current Price Undervalued 3% 16,392.15 7,611.57 4,430.93 12,042.50 2,182.00 657.00 9,860.50 226.30 43.57 40.99 6.30% APPENDIX 6 – BETA SENSITIVITY ANALYSIS Beta 1.4145 1.2891 1.1637 1.0383 0.9129 0.7875 0.6621 0.5367 0.4113 St. Deviation 2.00 1.50 1.00 0.50 0.00 -0.50 -1.00 -1.50 -2.00 Implied Price 24.96 28.28 32.30 37.28 43.57 51.81 63.02 79.18 104.47 Under (Over) Valued -39.11% -31.00% -21.19% -9.06% 6.30% 26.39% 53.75% 93.18% 154.87% ! 16 ! Dr Pepper Snapple Group, Inc. University of Oregon Investment Group http://uoig.uoregon.edu APPENDIX 6 – SOURCES • • • • • • • • • SEC Filings Dr Pepper Snapple Investor Relations Yahoo! Finance Google Finance Reuters Bloomberg The Wall Street Journal S&P NetAdvantage IBISWorld 17 !
