Comparison of Hate Crime Rates Across
Protected and Unprotected Groups –
An Update
by Rebecca L. Stotzer
University of Hawai‘i
January 2012
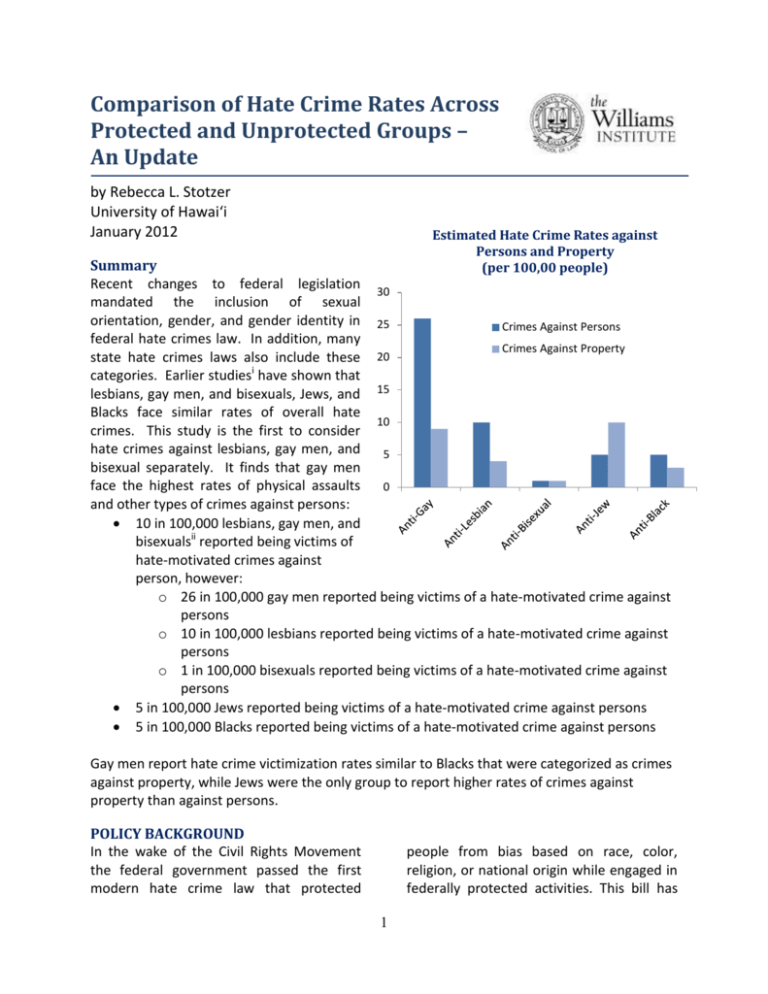
Estimated Hate Crime Rates against
Persons and Property
(per 100,00 people)
Summary
Recent changes to federal legislation
30
mandated the inclusion of sexual
orientation, gender, and gender identity in 25
Crimes Against Persons
federal hate crimes law. In addition, many
Crimes Against Property
state hate crimes laws also include these 20
categories. Earlier studiesi have shown that
lesbians, gay men, and bisexuals, Jews, and 15
Blacks face similar rates of overall hate
10
crimes. This study is the first to consider
hate crimes against lesbians, gay men, and
5
bisexual separately. It finds that gay men
face the highest rates of physical assaults
0
and other types of crimes against persons:
10 in 100,000 lesbians, gay men, and
bisexualsii reported being victims of
hate-motivated crimes against
person, however:
o 26 in 100,000 gay men reported being victims of a hate-motivated crime against
persons
o 10 in 100,000 lesbians reported being victims of a hate-motivated crime against
persons
o 1 in 100,000 bisexuals reported being victims of a hate-motivated crime against
persons
5 in 100,000 Jews reported being victims of a hate-motivated crime against persons
5 in 100,000 Blacks reported being victims of a hate-motivated crime against persons
Gay men report hate crime victimization rates similar to Blacks that were categorized as crimes
against property, while Jews were the only group to report higher rates of crimes against
property than against persons.
POLICY BACKGROUND
In the wake of the Civil Rights Movement
the federal government passed the first
modern hate crime law that protected
people from bias based on race, color,
religion, or national origin while engaged in
federally protected activities. This bill has
1
been amended numerous times as
increased attention has focused on hate
crimes. Most recently, the Matthew
Shepard and James Byrd, Jr. Hate Crimes
Prevention Act of 2009 added sexual
orientation, gender, gender identityiii, and
disability to the protected categories
covered by the law. The act also gave
federal officials the ability to coordinate
and provide aid to local law enforcement
agencies in the investigation and
prosecution of hate crimes, as well as gave
federal authorizes the ability to pursue hate
crimes that local officials decline to pursue.
This is in part a response to the different
types of hate crimes laws and inconsistency
in coverage contained within state laws
across the US. States may choose the
content of their hate crime laws, and are
not required to include the same categories
as the federal law. Since most crimes are
not federal offenses, states have a critical
role in providing protections for vulnerable
groups. However, 19 states in the US still do
not include sexual orientation as a
protected category, or do not have hate
crime laws at all.iv
perceived to be Black are the most
numerous in the race-based hate crimes,
people perceived to be Jewish are the most
numerous in the religion-based crimes, and
men perceived to be gay or bisexual were
the most commonly reported victims in the
sexual orientation-based hate crimes
category. However, these statistics do not
situate the counts in the context of the
overall population. For example, sexual
orientation-based hate crimes make up
roughly 30% of reported hate crimes each
year, but gay men, lesbians, and bisexuals
only make up 3.5% of the population.v In
addition, these are only representative of
the crimes that are being reported to local
law enforcement, who then choose to
report to the FBI. The probability that these
statistics under-represent the actual
number of hate crimes in the United States
is quite high.vi
In addition to tracking bias-motivation, the
FBI categorizes offenses into two main
types: crimes against persons and crimes
against property. Crimes against persons
are those crimes that have a direct physical
impact to the victim, such as rape, assault,
and murder.vii Crimes against property are
those crimes that focus instead on items
that belong to a person, such as vandalism,
arson, and burglary.viii
EXISTING HATE CRIME STATISTICS
Utilizing the mechanism of the Uniform
Crime Reports, the FBI has collected and
made available hate crime statistics
reported by local law enforcement agencies
since 1995. Their tracking provides a picture
of hate crimes across the US over the last
decade.
In order to highlight the differences in types
of victimization, this analysis utilized the
average number of hate crimes that were
categorized as crimes against persons or
crimes against property that were reported
by lesbians, gay men, or bisexuals; each of
these groups alone; Jews; and Blacks. Then,
the average number of person or property
hate crimes was divided by the estimated
population of each respective group in the
Race-based hate crimes are the most
commonly reported each year, followed by
religion-based hate crimes, then sexual
orientation-motivated hate crimes. Within
each of these three categories, there is a
consistent finding of particular groups that
are victimized the most – people who are
2
United States to estimate an overall rate of
potential victimization.
Gay men and Jews had the highest risk of
becoming victims of property crimes (9 and
10 in 100,000 respectively), while lesbians
and Blacks shared a similar level of reported
victimization of crimes against their
property (4 and 3 in 100,000 respectively).
ANALYSIS
Although prior research has suggested
that lesbians, gay men, and bisexuals,
Jews, and Blacks experience similar levels
of overall victimization,ix this study
demonstrates that these groups do not
experience the same types of hate crimes
and that when lesbians, gay men, and
bisexuals are considered separately, gay
men experience more hate crimes.
These findings suggest that hate crimes
data should be reported in a more nuanced
way and that a more nuanced approach
needs to be taken in addressing violence
against different protected groups.
Different
communities
experience
difference levels and different types of hate
crimes.
In particular, to better understand hate
crimes on the basis of sexual orientation,
more research is needed to explore why gay
men are more likely to experience and/or
report physical victimization and crimes
against their property, and why bisexuals
are less likely to experience and/or report
hate crimes.
When examining gay men, lesbians, and
bisexuals together, this group looks very
similar to other groups, with 10 in
100,000 LGB people reporting hate
crimes against their person compared to
5 in 100,000 against Blacks or Jews.
However, when gay men, lesbians, and
bisexuals are separated into unique
categories, important differences emerge.
Gay men report the greatest risk of being
the victims of hate-motivated physical
violence when compared with lesbians,
bisexuals, Blacks, and Jews, with 26 in
100,000 gay men reporting hate crimes
against persons. This finding is
particularly troubling given
prior
research that suggests that these sexual
orientation-motivated hate crimes against
persons tend to be more violent and more
likely to require hospitalization than
other types of crime.x
About the Author
Rebecca L. Stotzer, MSW, PhD, is an
Associate Professor and the Director of
Distance Education at the University of
Hawai‘i, Mānoa, in the Myron B. Thompson
School of Social Work. She received her
Ph.D. in Social Work and Psychology from
the University of Michigan, and was a
Williams Institute Public Policy Fellow from
2006 to 2007.
3
Table 1 – Rates of Hate-motivated Crimes against Persons & Property (2001-2010)
Anti-LGB
Anti-gay
Anti-lesbian
Anti-bisexual
Anti-Jew
Anti-Black
Avg.
Crimes
Against
Persons
792.9
650.5
142.2
11.7
327.9
2,007.2
Avg.
Crimes
Against
Property
279.7
223.1
56.6
9.3
649.1
1,171.8
Population
Estimates
8,038,780
2,491,034
1,359,801
4,187945
6,544,000
37,685,848
Rate of Crimes
Against Persons
10 in 100,000
26 in 100,000
10 in 100,000
1 in 100,000
5 in 100,000
5 in 100,000
Rate of Crimes
Against Property
4 in 100,000
9 in 100,000
4 in 100,000
1 in 100,000
10 in 100,000
3 in 100,000
APPENDIX – Calculating the Hate Crime Rates
Hate Crime Data
Hate crime data for African Americans, sexual minorities, Muslims, and Jews was taken from the FBI
Uniform Crime Reports from 2001-2010. Although the FBI is mandated to collect hate crime reports
from local agencies, the participation of local law enforcement in reporting to the FBI is largely
voluntary. Because of annual fluctuations based on current events and changes in reporting trends,
totals were averaged across these years for each group. It is worthy of noting that most local law
enforcement agencies include within “sexual orientation-motivated hate crimes” those crimes where
the the perpetrator, or even the investigating law enforcement officer, perceived the victim was gay,
lesbian or bisexual, regardless of how the victim defines themselves. Thus, these estimates may be
prone to categorizing victims as gay male rather than bisexual males, or lesbian female rather than
bisexual female, resulting in the low number of reported hate crimes against bisexuals.
Determining the Estimated Population for Gay Men, Lesbians, and Bisexuals
Gay, lesbian, and bisexual population estimates are derived from the Williams Institute Report How
Many People are Lesbian, Gay, Bisexual, and Transgender?, by Gary J. Gates. This report utilized four
different national and two state population-based surveys to create an estimate of the number of selfidentified gay, lesbian, bisexual and transgender people in the United States. This report concluded that
1.1% of women identify as lesbians, and 2.2% identify as bisexual, while 2.2% of men identify as gay, and
1.4% identify as bisexual (Gates, G. J. [2011]. How many people are lesbian, gay, bisexual, and
transgender? The Williams Institute: Los Angeles, CA. Figure 5).
Determining the Estimated Population for Blacks
The Black population figure comes from the 2010 U.S. Census and includes those who identify as one
race (Black) and who are not Latino/Hispanic (Summary File 1, Table P8 and P9). This figure includes the
entire population of children and adults in the calculation.
Determining the Estimated Population for Jews
Jewish population estimates are reported in the Statistical Abstract of the United States, 2008. Data was
collected from the American Jewish Yearbook, and is an estimate of those who identify as religiously or
culturally Jewish from local Jewish federations and other large community surveys. This includes the
entire population of children and adults in the calculation of risk.
4
i
Rubenstein, W. (2003). The real story of U.S. hate crime statistics: An empirical analysis. Tulane Law Review, 78, 1213-1246,
and Stotzer, R. L. (2007). Comparison of hate crime rates across protected and unprotected groups. Los Angeles, CA: Williams
Institute, UCLA School of Law. Available online at:
http://www.law.ucla.edu/williamsinstitute/publications/Comparison%20of%20Hate%20Crime%20Formatted.pdf
ii
Hate crimes laws are written to include both members of a particular group, and those who are perceived by the perpetrator
as belonging to that group, in their counts. Thus, each category includes victims who the perpetrator perceived to be gay,
lesbian, bisexual, Black, or Jewish, whether or not their perception was accurate. These counts also rely on police reports,
which may not accurately categorize the motives of the perpetrator (such as mislabeling bisexuals as lesbians or gay men),
based on the knowledge of the law enforcement officer investigating the case.
iii
Violence based on gender identity is not included in this paper. Until the passage of the Matthew Shepard and James Byrd Jr.,
Hate Crimes Prevention Act of 2009 the FBI was not mandated to collect data about hate crimes targeting people of varying
gender identities and presentation. However, surveys, advocacy group collection efforts, and police tracking all indicate high
levels of violence against transgender people and those with varying gender presentations that warrants future attention. See
Stotzer, R. L. (2009). Violence against transgender people: A review of United States data. Aggression and Violent Behavior, 14,
170-179.
iv
Human Rights Campaign, http://www.hrc.org/documents/hate_crime_laws.pdf
v
Gates, Gary J. [2011]. How many people are lesbian, gay, bisexual, and transgender? The Williams Institute: Los Angeles.
Available online at http://williamsinstitute.law.ucla.edu/wp-content/uploads/Gates-How-Many-People-LGBT-Apr-2011.pdf
vi
Wolf, Caroline (2005). Bureau of Justice Statistics, Special Report – Hate Crime Reported by Victims
and Police. Available online at: http://bjs.ojp.usdoj.gov/content/pub/pdf/hcrvp.pdf
vii
Murder and non-negligent manslaughter, forcible rape, aggravated assault, simple assault, intimidation, and “other” which
includes 34 Group A offenses that are collected in the National Incidence Based Reporting System:
http://www2.fbi.gov/ucr/hc2008/methodology.html
viii
Robbery, burglary, larceny-theft, motor vehicle theft, arson, destruction/damage/vandalism, and “other” which includes 34
Group A offenses that are collected in the National Incidence Based Reporting System:
http://www2.fbi.gov/ucr/hc2008/methodology.html
ix
Stotzer, R. L. (2007). Comparison of Hate Crime Rates Across Protected and Unprotected Groups. The Williams Institute, UCLA
School of Law. Available online at:
http://www.law.ucla.edu/williamsinstitute/publications/Comparison%20of%20Hate%20Crime%20Formatted.pdf
x
Kuehnle, K., & Sullivan, A. (2003). Gay and lesbian victimization: Reporting factors in domestic violence and bias incidents.
Criminal Justice and Behavior, 30, 85-96; Winer, A. S. (1994). Hate crimes, homosexuals, and the Constitution. Harvard Civil
Rights – Civil Liberties Law Review, 29, 387-438.
5

