Thermo Fisher Scientific
Molecular Spectroscopy
525 Verona Rd, Madison, WI 53711
(608) 276-6100
www.thermoscientific.com
picoSpin™ 45: The Fisher Esterification Reaction Synthesis of
Isopentyl Acetate (Banana oil)
Dean Antic, Ph.D., Thermo Fisher Scientific, Boulder, CO, USA
1. Introduction
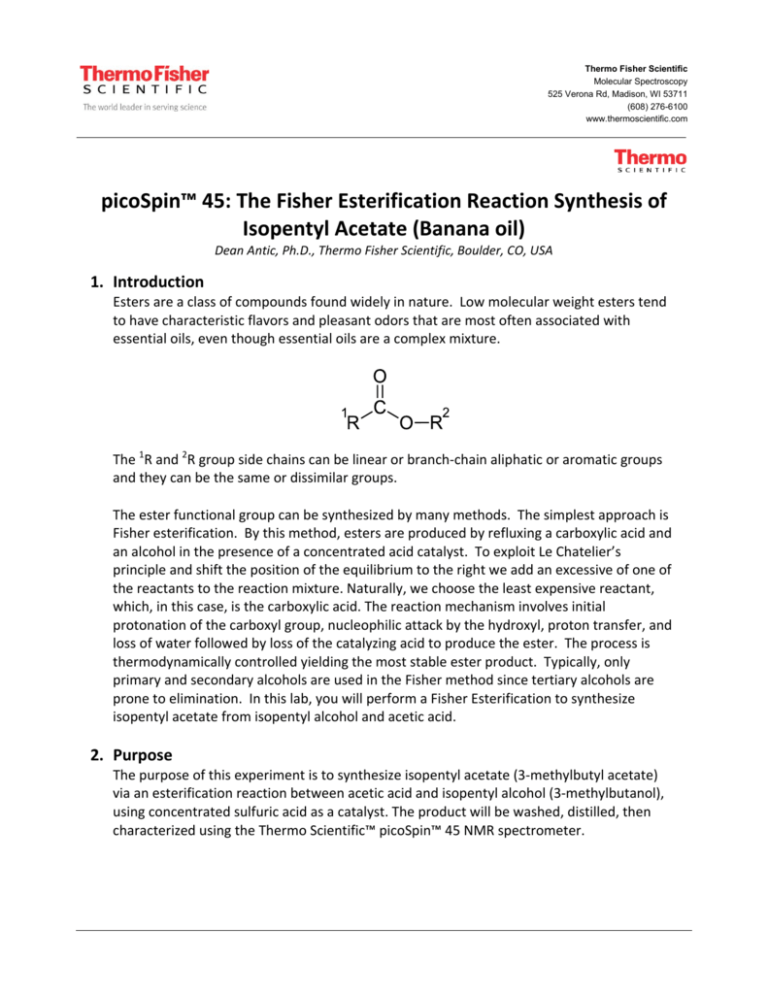
Esters are a class of compounds found widely in nature. Low molecular weight esters tend
to have characteristic flavors and pleasant odors that are most often associated with
essential oils, even though essential oils are a complex mixture.
The 1R and 2R group side chains can be linear or branch-chain aliphatic or aromatic groups
and they can be the same or dissimilar groups.
The ester functional group can be synthesized by many methods. The simplest approach is
Fisher esterification. By this method, esters are produced by refluxing a carboxylic acid and
an alcohol in the presence of a concentrated acid catalyst. To exploit Le Chatelier’s
principle and shift the position of the equilibrium to the right we add an excessive of one of
the reactants to the reaction mixture. Naturally, we choose the least expensive reactant,
which, in this case, is the carboxylic acid. The reaction mechanism involves initial
protonation of the carboxyl group, nucleophilic attack by the hydroxyl, proton transfer, and
loss of water followed by loss of the catalyzing acid to produce the ester. The process is
thermodynamically controlled yielding the most stable ester product. Typically, only
primary and secondary alcohols are used in the Fisher method since tertiary alcohols are
prone to elimination. In this lab, you will perform a Fisher Esterification to synthesize
isopentyl acetate from isopentyl alcohol and acetic acid.
2. Purpose
The purpose of this experiment is to synthesize isopentyl acetate (3-methylbutyl acetate)
via an esterification reaction between acetic acid and isopentyl alcohol (3-methylbutanol),
using concentrated sulfuric acid as a catalyst. The product will be washed, distilled, then
characterized using the Thermo Scientific™ picoSpin™ 45 NMR spectrometer.
3. Literature
Adapted from: Gokel, H. D.; Durst, G. W. Experimental Organic Chemistry; McGraw-Hill,
New York, 1980; pp 344-348.
CRC Handbook of Chemistry and Physics, 70th ed.; Weast, R.C., Ed.; CRC Press: Boca Raton,
FL, 1990.
4. Pulse Sequence
In this experiment, we use a standard 90° single pulse experiment. The recycle delay time
(d1) is adjusted to maximize signal intensity prior to signal averaging the next FID.
Sequence: d1−[ °−aq−d1]ns
°: Pulse rotation angle (flip angle)
FID: Free induction decay
d1: Recycle delay (µs) for spin-lattice
relaxation
p1: R.F. transmitter pulse length (µs)
aq: Acquisition time (ms)
ns: # of scans (individual FIDs)
5. Procedures and Analysis
Time requirements: 3-3.5 hrs
Difficulty: Moderate
Sample: acetic acid, isopentyl alcohol, isopentyl acetate
Equipment/materials:
• Thermo Scientific™ picoSpin™ 45
• Iron ring
• NMR processing software (Mnova) • Ice bath
• Ring stand
• Syringe filter (optional filter)
• Sand bath (or electric mantle)
• Syringe port
• Boiling chips
• Port Plug
• Separatory funnel
• Tubing
• Thermometer
• Reflux distillation apparatus
• Clamps (flask or Keck)
• 50 mL round bottom flask
• Simple distillation apparatus
• Condenser
• 100 mL round bottom flask
• Drying tube
• 25 mL Erlenmeyer flask
• picoSpin accessory kit
• Condenser
• 1 mL polypropylene syringes
• Three-way adapter
• 22 gauge blunt-tip dispensing needles
• Vacuum adapter
• Drain tube assembly
• Inlet filter
• Thermometer adapter
2
Physical data:
Substance
FW (g/mol) Quantity MP (°C) BP (°C) Density (g/mL)
acetic acid (anhydr.)
60.05
25 mL
118
1.049
isopentyl acetate
130.19
product
142
0.876
isopentyl alcohol
88.15
20 mL
130
0.809
conc. H2SO4
98.08
5 mL
1.841
5% NaHCO3
84.01
250 mL
1.0018
sat. NaCl
10 mL
Na2SO4 (anhydr.)
142.04
Reaction:
Mechanism:
Safety Precautions
CAUTION Eye protection should be worn at all times while using this
instrument. Sulfuric acid is a strong dehydrating agent; wear protective gloves when
pouring concentrated sulfuric acid. Acetic acid can burn the skin. Pour acetic acid in a fume
hood. Avoid contact with skin and clothes.
3
CAUTION Avoid shock hazard. Each wall outlet used must be equipped with a 3prong grounded outlet. The ground must be a noncurrent-carrying wire connected to earth
ground at the main distribution box.
Experimental Procedure
• To a 100 mL round bottom flask add 25 mL (0.420 mol) glacial acetic acid (Caution:
Hood) followed by 20 mL (0.185 mL) isopentyl alcohol (3-methyl-1-butanol). Swirl the
flask to mix the layers.
• To the solution add (carefully, gloves) 5 mL concentrated sulfuric acid. Swirl the flask
while sulfuric acid is added (heat generated).
• Add several boiling chips to the flask then place a reflux condenser with lightly greased
joints on the flask as shown in Figure 1
• Bring the solution to boil using a sand bath, electric mantel or flame and reflux for 1 hr.
Figure 1. Reflux apparatus with exclusion of moisture
• After reflux is completed, allow the solution to cool to room temperature.
• Transfer the entire solution to a separatory funnel and add 50 mL distilled water. Swirl
the solution, allow the layers to separate and remove the lower aqueous layer.
• Add another 25 mL portion of distilled water, shake the flask, and separate and remove
the lower aqueous layer.
• Extract the organic layer with three 25 mL portions of 5% aqueous sodium bicarbonate
solution to remove excess acetic acid (Note: Be careful, as carbon dioxide is given off
during extraction.)
• Test the last extract and if the aqueous phase is not basic (pH paper), extract the organic
layer with two more 25 mL portions of sodium bicarbonate solution (NaHCO3).
4
• After removal of the acetic acid, wash the organic layer with two 5 mL portions of
saturated salt solution.
• Transfer the organic layer to a 50 mL Erlenmeyer flask and dry over granular anhydrous
sodium sulfate (Na2SO4) or magnesium sulfate (MgSO4).
• After drying, the liquid should be clear; decant the organic layer into a 50 mL round
bottom flask.
• Assemble a simple distillation apparatus as shown in Figure 2. Add several boiling chips
and distill using a sand bath, electric mantel or flame. Cool the receiver flask in an ice
bath.
• Collect the fraction that distills between 135°C and 143°C. The clear colorless product
has an intense odor of bananas; it should be obtained in 80-90% yield.
Figure 2 Simple distillation apparatus with sand bath
Analysis
Required:
Acquire 1H NMR spectra of:
• Acetic acid (reactant)
• 3-Methyl butanol (reactant)
• 3-Methylbutyl acetate (distilled product)
Optional:
Acquire 1H NMR spectra of:
• Initial reaction mixture (prior to reflux)
• Reaction mixture after reflux
• After H2O wash and NaHCO3 wash
• After NaHCO3 wash, salt extraction and drying
5
NMR Sample preparation
Using a new, disposable 1mL polypropylene syringe fitted with a 1½"-22 gauge blunt-tip
needle draw about 0.5 mL of glacial acetic acid (Caution: Hood) and transfer it to a 0.5 or
1 dram vial.
If available, to this sample, using a new, disposable 1mL polypropylene syringe fitted with
a 1½"-22 gauge blunt-tip needle, rapidly draw out and add 6-10 droplets of
tetramethylsilane (TMS). NOTE: TMS will begin to boil immediately after insertion of the
syringe needle. Thus, sample transfer must be rapid.
Repeat this procedure for preparing samples of 3-methylbutanol and 3-methylbutyl
acetate for NMR analysis. NOTE: Some of the Optional samples are aqueous and
therefore TMS should not be added.
Instrumental procedure
The general procedure for sample analysis using a picoSpin NMR spectrometer is as
follows:
Shim
Prepare
Inject
Acquire
Analyze
Shim
• Ensure the NMR spectrometer is shimmed and ready to accept samples.
Pre-sample preparation
• Displace the shim fluid from the picoSpin capillary cartridge with air.
• Flush the cartridge with 0.1 mL of chloroform, and then displace the solvent with an air
push. A small signal in your sample spectrum may appear at 7.24 ppm due to residual
CHCl3, it can be used to shift reference the spectrum.
• Set up the onePulse script according to parameters listed in the Pulse Script table.
Injection
• Using a 1 mL disposable polypropylene syringe fitted with a 1.5” long, 22 gauge blunt-tip
needle, withdraw a 0.2 mL aliquot of sample.
• Inject about half the sample. Ensure all air bubbles have been displaced from the
cartridge by examining the drain tube.
• Seal both the inlet and outlet ports with PEEK plugs.
Acquire
• Execute the onePulse script according to the values in the table of parameters provided
6
• Once the onePulse script has finished, prepare the cartridge for the next user by
displacing the sample from the cartridge according to the following protocol: air,
solvent, air.
Pulse Script: onePulse
Parameter
Value
tx frequency (tx)
proton Larmor frequency (MHz)
scans (ns)
16 or 25
pulse length (p1)
Instrument specific 90° pulse length
acquisition time (aq)
750 ms
rx recovery delay (r1)
500 µs
T1 recycle delay (d1)
10 s
bandwidth (bw)
4 kHz
post-filter atten. (pfa) 10 (11)a
phase correction (ph) 0 degrees (or any value)
exp. filter (LB)
0 Hz
max plot points
400
max time to plot
250 ms
min freq. to plot
-200 Hz
max freq. to plot
+1000 Hz
zero filling (zf)
8192
align-avg. data
live plot
JCAMP avg.
JCAMP ind.
Unchecked
a
Choose the instrument’s default pfa values
6. Processing
Download the experimental JCAMP spectra files and open them by importing into Mnova.
The free induction decay (FID) will undergo automatic Fourier transformation and a
spectrum will be displayed.
To each spectrum, apply the following processing steps using the given settings:
Function
Zero-filling (zf) & Linear Predict (LP)
Forward predict (FP)
Backward predict (BP)
Phase Correction (PH)
Apodization
Value
16 k
From aq → 16 k
From -2 → 0
PH0: Manually adjust
PH1: 0
7
Exponential (LB)
First Point
Shift reference (CS)
Peak Picking (pp)
Integration (I)
Multiplet Analysis (J)
0.6 Hz
0.5
Manually reference
Manually Select Peaks
Automatic Selection
-
• Import each data file into the same workspace in Mnova. Manually apply Ph0 phase
correction to each spectrum.
• Manually shift reference each spectrum using Mnova’s TMS tool. Assign the TMS signal
(0 ppm) or CHCl3 signal (7.24 ppm), whichever is present.
• Identify and assign each signal in the spectra.
• Save the Mnova document, print each spectrum and paste into your lab notebook.
7. Results
Acetic acid (Figure 3) contains a carboxylic acid. Proton (1H) NMR spectra of neat carboxylic
acids are identified by a characteristic downfield (high frequency) chemical shift of the acid
proton. The acidic nature of carboxylic acid protons make them strongly deshielded, with
signals typically appearing between 11-12 ppm. Acidic protons also experience
intramolecular hydrogen bonding and exchange rapidly, and rapidly exchanging protons
tend to result in narrow signals. Adding a drop of D2O (heavy water) to the sample causes
the peak to disappear; this is evidence for the presence of a carboxylic acid, but then labile
protons from alcohols, amines, thiols, phenols and enols will also exhibit this exchange
behavior. Similarly, acidic protons experience intermolecular exchange with labile protons
from other compounds, such as water, causing the signal to broaden and shift upfield (low
frequency), closer to the labile proton chemical shift.
A characteristic feature of the 1H NMR spectrum of 3-methylbutanol (Figure 4) is the
presence of a coupled alcohol triplet appearing near 5 ppm. One reason a triplet structure
is observed is that alcohol protons undergo dynamic exchange at various rates. Fast
exchange leads to hydroxyl protons that do not couple with neighboring protons, resulting
in a singlet. However, slow exchange allows time for coupling, such as that observed in 3methylbutanol where the hydroxyl group proton couples with two methylene protons on
the neighboring C4 carbon, resulting in a triplet. Steric hindrance and intramolecular
bonding can also interfere with dynamic exchange, allowing for coupling to adjacent
protons. The C4 protons (3.5 ppm) in turn couples with the alcohol and two methylene
protons at position C3, generating a quartet signal instead of a triplet.
As the reaction proceeds and 3-methylbutyl acetate is produced (Figure 5), two distinctive
spectral features will appear in its NMR spectrum. The alcohol signal of 3-methylbutanol will
disappear and the C4 proton quartet will change into a triplet due to the loss of an adjacent
8
alcohol proton; it will also shift downfield by 0.5 ppm, from 3.5 ppm to 4.0 ppm. The
downfield shift of C4 protons arises from increased deshielding of these protons as the
adjacent alcohol group is transformed into the more electron-withdrawing ester functional
group. Furthermore, evidence of the formation of product is seen in the presence of a
singlet group appearing at just below 2 ppm; this signal belongs to the methyl ester group
(C1) of the carboxyl group (Figure 3 and Figure 5). The remaining signal groups due to
protons within the isobutyl group (C1-3,5 in 3-methylbutanol; C5-7,9 in 3-methylbutyl acetate)
are largely unchanged upon esterification of 3-methylbutanol.
Figure 3 Full 1H NMR (45 MHz) spectrum of acetic acid (anhdyr.; neat)
9
Figure 4 Full 1H NMR (45 MHz) spectrum of 3-methylbutanol (neat).
10
Figure 5 Full 1H NMR (45 MHz) spectrum of 3-methylbutyl acetate (neat).
8. Comments
picoSpin 45 1H NMR proton spectra of neat acetic acid, 3-methylbutanol and 3-methylbutyl
acetate are show in Figure 3-5. Chemical shifts and related NMR data are available in Table
1. Chemical shifts are referenced relative to TMS. Spectra are acquired from neat samples
of reactants and product, and aliquots drawn from reaction mixtures. With the picoSpin 45
NMR spectrometer, it is not necessary to dilute samples prior to injection. However, 3methylbutanol is somewhat viscous resulting in broadened signals, more so than 3methylbutyl acetate, and dilution to 50% in CDCl3 can improve signal resolution. Using a
labile deuterated NMR solvent will result in the hydroxyl (OH) protons to exchange and its
signal will diminish or disappear from the spectrum. Likewise, coupling to the methylene
(C4) proton will also be affected.
Presented in Figure 6- 8 are stacked 1H NMR spectra acquired from neat reactants, isolated
product, and spectra acquired from the reaction mixture during various stages of the
experiment. These spectra are instructive in that they demonstrate the need for proper
11
‘work up’ of the reaction mixture prior to product distillation and isolation. Moreover, it is
easy to visualize the changes in 1H NMR spectra as reactants are converted to products.
Figure 6 compares reactants and products, while Figure 7 includes the initial reaction
mixture prior to addition of the acid catalyst (H2SO4). We see a hydroxyl signal appearing
near 9.3 ppm, the apparent change of the methylene quartet to a triplet (~3.5 ppm), the
appearance of a second methyl ester ‘singlet’ below 2.0 ppm and the broadening of all
signals. The chemical shift of the OH group reflects the rapid exchange between the
carboxylic acid proton and the alcohol, coalescing into one signal. Its position is dictated by
the relative mole fraction of each component (acid and alcohol); that is, its chemical shift is
linearly dependent on the mole fraction of the two labile protons under exchange. This is a
well-known phenomenon to occur with mixtures of alcohols.
Looking at Figure 8 we see in the ‘after reflux’ spectrum (4th spectrum from the bottom)
distinct and resolved singlet resonances due to the each type of carboxyl methyl group; one
at 2.05 ppm from acetic acid and a second one at 1.93 ppm arising from the methyl ester
product. The methylene ester (CH2-O) appears shifted downfield to 4.0 ppm and is a clear
triplet structure. In addition, due to the presence of mineral acid (H2SO4) the coalesced
hydroxyl/carboxylic acid signal, appearing at 9.3 ppm in the initial reaction mixture, is
further broaden and now centered on 9.7 ppm. The additional downfield shift arises from
an increase of H+ ions to the mixture.
After a water wash and neutralization with sodium bicarbonate (NaHCO3), the merged labile
hydroxyl/carboxylic acid proton signal (9.7 ppm) and the carboxylic acid signal (2.05 ppm)
disappear (3rd spectrum from top). The methylene ester (CH2-O) shows better resolution;
also, a residual water signal is present. An additional NaHCO3 wash, followed by salt
extraction and drying of Na2SO4 (or MgSO4) cleans up the product spectrum prior to
distillation (2nd spectrum from top). The top two spectra in Figure 8 establish that even
prior to distillation, the product 3-methylbutyl acetate is well isolated, and the ‘before and
after’ distillation spectra appear nearly identical.
Table 1. 1H NMR Spectral Data
Figure
Compound
Signal Group
3
acetic Acid
TMS
HO-C(=O)CH3
HO-C(=O)CH3
4
3-methylbutanol
TMS
-CH-(CH3)2
-CH2-CH2-CH-CH-(CH3)2
Chemical Shift
(ppm)
0
2.05
11.51
0
0.90
1.47
Nuclides
Multiplicity
12 H
3H
1H
singlet
singlet
singlet
6H
2H
1H
singlet
doublet
triplet
multiplet
12
5
3-methylbutyl acetate
-CH2-CH-(CH3)2
HO-CH2CH2
3.56
4.99
2H
1H
quartet
triplet
TMS
-CH-(CH3)2
-CH2-CH2-CH-CH2-CH-(CH3)2
CH3COOO=CO-CH2-CH2
0
0.91
1.53
12 H
6H
2H
1H
3H
2H
singlet
doublet
triplet
multiplet
singlet
triplet
1.93
4.05
Figure 6 Full, stacked and labeled 1H NMR (45 MHz) spectra of acetic acid and 3-methylbutanol
(reactants), and 3-methylbutyl acetate (product)
13
Figure 7 Full, stacked and labeled 1H NMR (45 MHz) spectra of acetic acid and 3-methylbutanol
(reactants), 3-methylbutyl acetate (product), and the initial reaction mixture prior to reflux.
14
Figure 8 Full, stacked and labeled 1H NMR (45 MHz) spectra of acetic acid and 3-methylbutanol
(reactants), 3-methylbutyl acetate (product), and spectra acquired after different times during
the experiment.
9. Own Observations
15
www.thermoscientific.com
© 2014 Thermo Fisher Scientific Inc. All rights reserved. All trademarks are the property of Thermo Fisher Scientific and its
subsidiaries. Specifications, terms and pricing are subject to change. Not all products are available in all countries. Please
consult your local sales representative for details.
Africa +43 1 333 50 34 0
Australia +61 3 9757 4300
Austria +43 810 282 206
Belgium +32 53 73 42 41
Canada +1 800 530 8447
China +86 21 6865 4588
FL52575_E_03/14
Denmark +45 70 23 62 60
Europe-Other +43 1 333 50 34 0
Finland/Norway/Sweden
+46 8 556 468 00
France +33 1 60 92 48 00
Germany +49 6103 408 1014
India +91 22 6742 9494
Italy +39 02 950 591
Japan +81 45 453 9100
Latin America +1 561 688 8700
Middle East +43 1 333 50 34 0
Netherlands +31 76 579 55 55
New Zealand +64 9 980 6700
Russia/CIS +43 1 333 50 34 0
Spain +34 914 845 965
Switzerland +41 61 716 77 00
UK +44 1442 233555
USA +1 800 532 4752
16

