Lab 3 Newtonian Dynamics
Lab 1 Qualitative Dynamics
I.
Objectives
• Represent dynamics problem using words, sketches, and diagrams.
• Use these representations to reason about physical processes
• Use Newton’s second law and diagrammatic representations to qualitatively predict the outcome of experiments—a qualitative test of the law.
II.
How are an object’s motion and the forces exerted on it related?
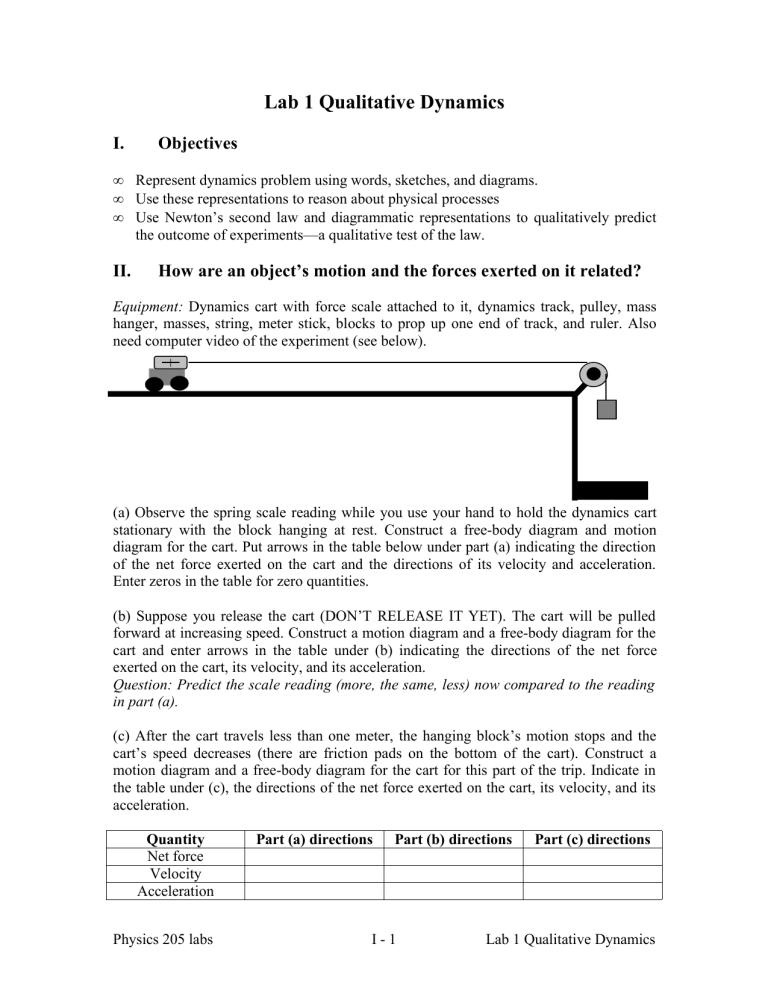
Equipment: Dynamics cart with force scale attached to it, dynamics track, pulley, mass hanger, masses, string, meter stick, blocks to prop up one end of track, and ruler. Also need computer video of the experiment (see below).
(a) Observe the spring scale reading while you use your hand to hold the dynamics cart stationary with the block hanging at rest. Construct a free-body diagram and motion diagram for the cart. Put arrows in the table below under part (a) indicating the direction of the net force exerted on the cart and the directions of its velocity and acceleration.
Enter zeros in the table for zero quantities.
(b) Suppose you release the cart (DON’T RELEASE IT YET). The cart will be pulled forward at increasing speed. Construct a motion diagram and a free-body diagram for the cart and enter arrows in the table under (b) indicating the directions of the net force exerted on the cart, its velocity, and its acceleration.
Question: Predict the scale reading (more, the same, less) now compared to the reading in part (a).
(c) After the cart travels less than one meter, the hanging block’s motion stops and the cart’s speed decreases (there are friction pads on the bottom of the cart). Construct a motion diagram and a free-body diagram for the cart for this part of the trip. Indicate in the table under (c), the directions of the net force exerted on the cart, its velocity, and its acceleration.
Quantity
Net force
Velocity
Acceleration
Part (a) directions Part (b) directions Part (c) directions
Physics 205 labs I - 1 Lab 1 Qualitative Dynamics
Based on the information in the table, decide if there appears to be any relationship between the net force exerted on the cart and some quantity that describes the cart’s motion. Indicate that relationship. Check your work with the lab instructor.
After your predictions, run the video of this experiment, which allows you to see at leisure the scale reading in part (b) compared to the reading in part (a)—the answer to the question above. You can also try the experiment to confirm this result. If your prediction is incorrect, reconcile the observation with your diagrammatic thinking.
III.
Magnitude of acceleration when sliding up compared to when sliding down
Tilt the dynamics cart upward at about 15 o above the horizontal. Place a sonic ranger at the top end of the track—it is used to measure the cart’s position, velocity and acceleration. Suppose you give the cart a push so that it coasts upward along the inclined track (the cart has a friction pad on the bottom). Construct a motion diagram and a freebody diagram for the cart when moving up the track toward the motion detector and another set of diagrams for when the cart coasts back down the track. Use the diagrams to help predict in which case the acceleration has the greatest magnitude—going up the track or back down the track. After showing your diagrams and prediction to the lab instructor, try the experiment. Reconcile any difference in your prediction with what you observe.
Instructions for using the Motion Sensor
1. After turning on the PC, log on as Student (no password required) and look for the
“Course Folders” folder on the Desktop. Open that, open the 205 folder and the experiment folder inside that. Double-click on the file called “Motion Sensor.XMBL” and three Logger Pro graphs should appear – Displacement, Velocity, and Acceleration.
2. Press the “Collect” button in Logger Projust before you set the experiment in motion.
Real-time data will be displayed on the graphs, and data will continue to be taken for as long as the time interval between the leftmost and rightmost times on the X (time) axis.
To do another run, simply press the Collect button.
IV.
Using motion diagrams, free-body diagrams, and Newton’s second law to reason about physical processes
Complete ActivPhysics activities 2.1.1-2.1.5
. Be sure to make predictions before trying each experiment (follow the instructions that accompany the simulations). Be sure that your motion diagrams and free-body diagrams for each experiment are consistent with
Newton’s second law, that is, the acceleration direction and net force should be in the same direction or if one is zero, the other should also be zero. Show your work to the lab instructor.
Physics 205 labs I - 2 Lab 1 Qualitative Dynamics


