Homework Assignment – XI - CIE Economics Q.1 The
advertisement
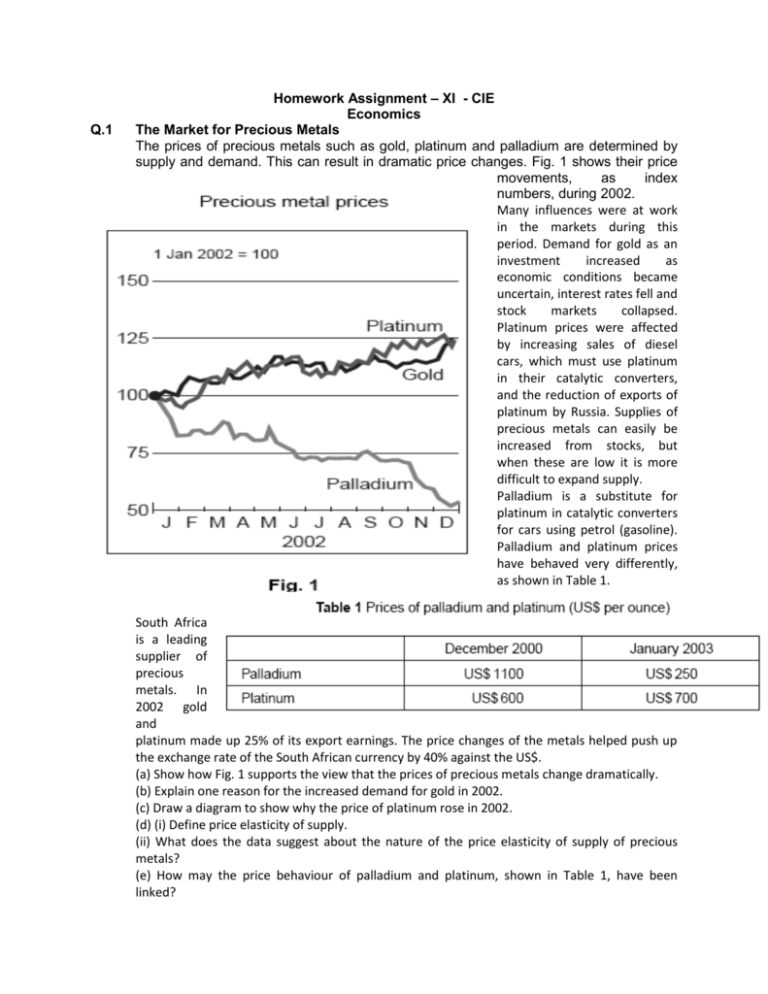
Q.1 Homework Assignment – XI - CIE Economics The Market for Precious Metals The prices of precious metals such as gold, platinum and palladium are determined by supply and demand. This can result in dramatic price changes. Fig. 1 shows their price movements, as index numbers, during 2002. Many influences were at work in the markets during this period. Demand for gold as an investment increased as economic conditions became uncertain, interest rates fell and stock markets collapsed. Platinum prices were affected by increasing sales of diesel cars, which must use platinum in their catalytic converters, and the reduction of exports of platinum by Russia. Supplies of precious metals can easily be increased from stocks, but when these are low it is more difficult to expand supply. Palladium is a substitute for platinum in catalytic converters for cars using petrol (gasoline). Palladium and platinum prices have behaved very differently, as shown in Table 1. South Africa is a leading supplier of precious metals. In 2002 gold and platinum made up 25% of its export earnings. The price changes of the metals helped push up the exchange rate of the South African currency by 40% against the US$. (a) Show how Fig. 1 supports the view that the prices of precious metals change dramatically. (b) Explain one reason for the increased demand for gold in 2002. (c) Draw a diagram to show why the price of platinum rose in 2002. (d) (i) Define price elasticity of supply. (ii) What does the data suggest about the nature of the price elasticity of supply of precious metals? (e) How may the price behaviour of palladium and platinum, shown in Table 1, have been linked? (f) Discuss the possible effects on the South African economy of the rise in the prices of gold and platinum. Q2 (a) Explain the differences in the features of a market economy and a planned economy. (b) Discuss the desirability of the direct provision of goods and services by the government. Q3 (a) An economy is faced by the exhaustion of an important natural resource at a time when it is introducing improved technology. Explain how these events will affect the economy’s production possibility curve. (b) Discuss whether the operation of a market economy always produces a desirable outcome. Q4 (a) Increasing raw material costs cause the price of a good to rise. Explain the effect of this price rise for the good on the markets for its substitute and complementary goods. (b) Discuss the usefulness to businesses of a knowledge of price elasticity of demand and income elasticity of demand. Q5 (a) Explain the three economic questions that all economies face because of the basic economic problem. (b) Discuss whether the price mechanism is an effective way to solve the basic economic problem. Q6 20104 (a) Using a normal demand curve, explain how consumer surplus occurs. (b) With the help of diagrams, discuss whether consumers will benefit from the introduction on a product of (i) an indirect tax, and (ii) an effective maximum price. Q7 (a) Explain what is meant by a current account deficit. (b) Discuss the effectiveness and desirability of imposing tariffs to correct a current account deficit. Q8 (a) Explain what determines a country’s comparative advantage in production. (b) Discuss the effectiveness of expenditure-switching policies in reducing a current account deficit on the balance of payments. Q.9 Answer this question. Two Asian Giants China has the world’s largest population and is experiencing rapid economic growth from a low base. It has recently joined the World Trade Organisation (WTO) with an obligation to open its economy to freer international trade. In 2002 an economic spokesman for neighbouring Japan stated that this did not mean that China was a threat to Japan’s position as ‘the factory of the world’. He claimed that China was a labourintensive, low-cost producer, while Japan was ahead in technology-intensive products. He quoted television production, where Japan specialised in high quality models, while China produced standard models. Engineering and electronics showed similar positions. He argued that Chinese export competitiveness was based on cheap labour which reflected poor labour productivity. He added that half of Chinese exports were produced by subsidiaries of foreign firms, many of them Japanese. However, he warned that the presence of these subsidiaries might lead to an increased transfer of technology to China. Table 1 shows some economic aspects of the two countries in 2000. Table 1 (a) Suggest two steps that a country might take to open its economy to freer international trade. [2] (b) (i) Explain why the comparative advantage of Japan and China differs. [4] (ii) Compare the importance of international trade to the two countries. [4] (c) Comment on the inflation figures for the two countries. [4] (d) Discuss whether China offers an economic threat or opportunity to Japan. [6] Q.10. The World Potato Market 2008 was the International Year of the Potato. The Swiss Government even celebrated the event by issuing a postage stamp showing a picture of a potato. In recent years there have been considerable changes in the international market for potatoes. Table 1 shows changes in the supply of potatoes from developed and developing countries. Table 1: World potato production 1991–2007 (million tonnes) The nature of the trade in potatoes has also changed as the growth of trade in processed products, such as frozen and dehydrated potatoes, has overtaken trade in fresh potatoes. Processed potatoes are used by fast food, snack and convenience food industries and sell at higher prices than fresh potatoes. Tariffs, food health standards and technical regulations are used by some countries to protect domestic potato markets. Potatoes provide a good example of ‘tariff escalation’, where a country imposes higher tariffs on processed products than it does on raw materials. For example the average world tariff on fresh potatoes was 29%, while that on some processed potato products ranged from 38% to 109%. 3 (a) Use Table 1 to identify the main changes in world potato production between 1991 and 2007. [3] (b) With reference to Table 2, what might explain the different production per hectare in North America and Africa? [3] (c) Explain two possible reasons for different levels of potato consumption. [4] (d) Consider the likely cross elasticity of demand between fresh potatoes and processed potatoes. [4] (e) Discuss the effect on world trade and welfare of the spread of ‘tariff escalation’. [6] Homework Assignment (Multiple Choice Questions) Economics – XI – CIE 1 What is the opportunity cost to a fully employed economy of increasing capital investment? A a fall in consumption B a fall in income C a rise in saving D a rise in the rate of interest 2 The diagram shows a production possibility curve for an economy which produces only two goods, X and Y. D It gives all consumers an equal voice in deciding how resources should be allocated. 5 In August 2002, the US President signed a trade agreement which allowed more duty-free access to the US market for Latin American and Caribbean countries. Who might benefit in the short run from this agreement? A Caribbean countries, because they may export to Latin America B Latin American businesses, because they may be able to sell more in the US C Latin American governments, because they will not have to pay so much duty D the US, because it may export more to Latin America 6 The diagram shows the demand curve for a product. If the rectangle OLMN is equal in area to the rectangle OPQR, which statement is correct? The economy produces 400 of good Y and produces on its production possibility curve. Which quantity of good X is given up? A 600 B 800 C 1200 D 1600 3 Which group may be disadvantaged by the introduction of division of labour? A consumers who prefer standardised goods B companies where the production process has many sub-divisions C the government, if the product is taxed D workers who prefer a variety of tasks 4 What is an advantage of using the market mechanism to allocate resources between alternative uses? A It ensures that resources will be allocated efficiently. B It ensures that resources are allocated in accordance with need. C It minimises the time required to make decisions. A Total revenue falls by MSQ if the price rises from OR to ON. B Consumer surplus falls by RSMN if the price rises from OR to ON. C The price elasticity of demand is unitary for all changes in price. D A rise in price from OR to ON results in the same proportionate fall in quantity demanded. 7 During a certain period, 10 000 units of a normal good are sold at a price of 20 c. During a later period, 12000 units are sold at a price of 22 c. What could explain this change? A a reduction in consumers' incomes B an increase in the cost of raw materials C an increase in the price of a substitute commodity D an increase in the productivity of factors of production 8 In the diagram below D1 and S1 represent the demand and supply curves of a Malaysian industry in its home market. Equilibrium is at X. The industry has to pay a large wage increase and at the same time faces increased competition from imported substitutes. Which point, A, B, C, or D, on the diagram could represent the new equilibrium? What would be the change in the volume of rail travel resulting from a 1% increase in bus fares? A an increase of 0.16 % B an increase of 0.43 % C a reduction of 0.13 % D a reduction of 0.37 % 11 The table shows a consumer's expenditure on a range of goods at different levels of income. For which good does the consumer have an income elasticity of demand greater than zero, but less than one? 9 In 2002 it was proposed that car owners should pay a charge to travel into the centre of London. Fares on public transport would also be reduced. It was hoped that more use would be made of public transport and that congestion would decrease. What price elasticities of demand would be necessary for this policy to succeed? 10 The table gives estimates of the price elasticities and cross-elasticities of demand for bus and rail travel. 12 Which of the supply curves shown in the diagram has unitary price elasticity? A B C D 13 The diagram shows the demand and supply curves for a product. The government then sets both a maximum spectacle price of PX and a minimum price of PM. What effect will these measures have on the market for spectacles? A create a shortage of spectacles equal to Q1Q5 B create a surplus of spectacles equal to Q2Q4 C create a surplus of spectacles equal to Q3Q4 D leave the quantity bought and sold unchanged Which area measures the total amount consumers would be willing to pay for the equilibrium level of output? A OWYZ B OXYZ C OVYZ D XYV 14 In the diagram, Q1 is the quantity produced of a good as the result of market forces. What concept is present at output Q1? A a government subsidy B a negative externality C excess supply D price instability 15 The diagram shows the market for spectacles. Initially the market equilibrium price is PO and quantity Q3 is bought and sold. 16 What is always a characteristic of a public good? A Consumption of the good by one individual prevents consumption by any other individual. B It confers benefits on consumers that are greater than they themselves realise. C It is supplied by a voluntary organisation. D The benefits it confers on consumers can be extended to others at zero cost. 17 Brazil and Colombia attempt to control the supply of coffee in the world market to help stabilize their incomes. What condition is essential for this to stabilise their incomes effectively? A There must be large firms in the industry. B It must be possible to store the coffee and release stocks when necessary. C Other countries must supply a significant percentage of the total market. D The demand for the product must be elastic. 18 An international oil company announced in 2002 that it would not continue to explore for oil off the coast of Namibia. This was because there was only enough oil to support a local power station for Namibia and not enough to allow exports of oil. What might be a possible advantage and disadvantage to Namibia of this decision? Later, each country specialises in the product in which it has a comparative advantage. Which rate of exchange would be suitable so each country gains from trade? A 1X = 1Y B 1X = 1.5Y C 1X = 2Y D 1X = 3Y 19 Which method of protection raises revenue for the government? A domestic subsidies B embargo C quota D tariff 20 In which of the following situations will a country’s terms of trade worsen? A The prices of its imports rise by more than the prices of its exports. B The total value of external payments rises by more than the total value of external receipts. C The value of its imports rises by more than the value of its exports. D The volume of its imports rises by more than the volume of its exports. 21 The World Cup in 2002 caused a rise in demand by Japanese fans for football shirts made in Brazil, and increased travel to Japan by Brazilian fans using Japanese airlines. What would be the effect on Brazil’s balance of payments? 22 The table shows the numbers of goods X and Y which two countries produce. Each country uses half of its resources to make each good. 23 In an economy, both employment and unemployment rose over a ten year period. What must have risen? A birth rate B life expectancy C unemployment benefits D working population 24 The diagram gives details of different aspects of productivity in the US and UK. Which sector in the UK best fits the description ‘a sector with a relatively fast growth rate in productivity but which is less productive than its US equivalent’? 25The diagram shows production possibility curves for two countries, X and Y. D The exchange rate in 2001 was approximately NZ$ 1 = S$ 1.2. 28 The diagram shows the market for Japanese Yen. What can be deduced from the diagram? A Both countries can benefit by specialisation. B Country X has a higher opportunity cost than Y in producing good B. C Country Y has a comparative advantage in both goods. D Trade between X and Y will not take place. 26 An argument against trade protection is that it will increase A competition for domestic industries. B domestic price levels. C the current account deficit. D opportunities for domestic infant industries. 27 The table gives information about the trade between Singapore and New Zealand during 2001, the first year after they signed a free trade agreement. The values are given both in Singapore dollars (S$) and New Zealand dollars (NZ$). What can be concluded from the table? A New Zealand gained more than Singapore from the trade agreement. B New Zealand’s trade position with Singapore improved in 2001. C Singapore had a trade surplus with New Zealand in 2001. What could have caused the change in the supply of Yen from S1 to S2? A a reduction in the level of international investment into Japan B a reduction in the level of Japanese tariffs C a reduction in the value of foreign goods imported into Japan D a reduction in the value of Japanese goods exported 29 The value of the Swiss franc changes against the US dollar ($) from $0.60 to $0.80. Which statement is consistent with this information? A Swiss visitors to the US will now be worse off. B The cost to the US of maintaining its embassy in Switzerland will decrease. C The dollar has depreciated against the Swiss franc. D US exports to Switzerland will now be more expensive. 30 In the last ten years e-mail has increasingly been used in preference to postal services. Which graph shows the changes in the market for postal services?
