From: CCNA Security
Chapter 6 Lab A: Using Cisco SPAN
Topology
The purpose of this lab is to
become more familiar with
some essential tools for
network administration and
trouble-shooting.
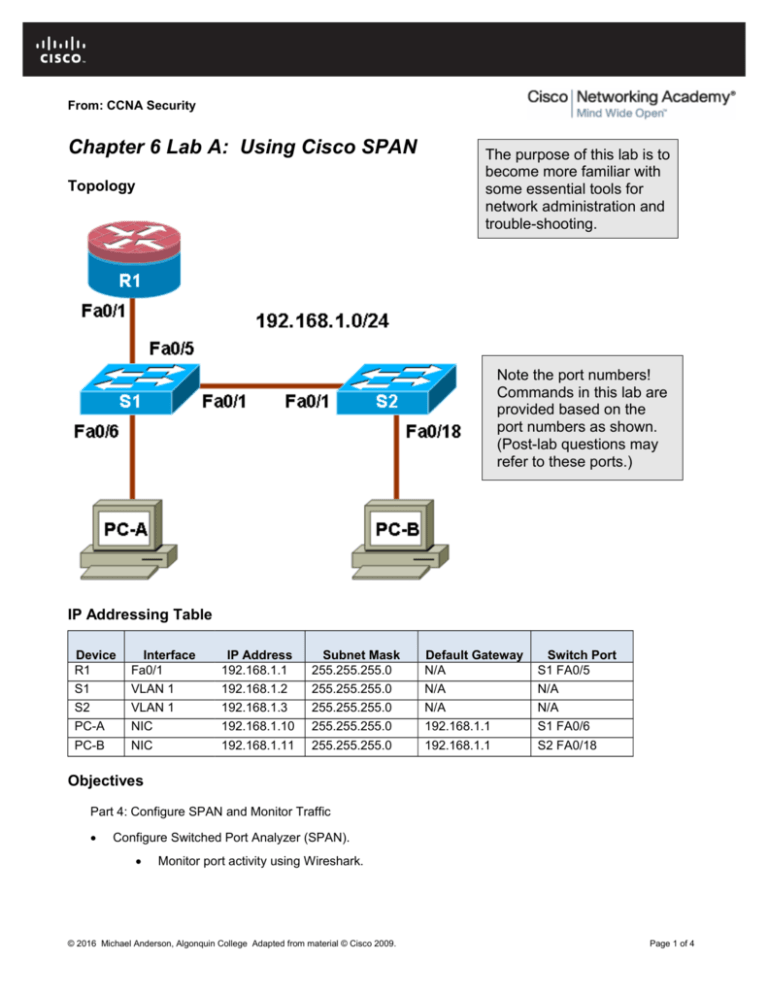
Note the port numbers!
Commands in this lab are
provided based on the
port numbers as shown.
(Post-lab questions may
refer to these ports.)
IP Addressing Table
Device
R1
S1
S2
PC-A
PC-B
Interface
Fa0/1
VLAN 1
VLAN 1
NIC
NIC
IP Address
192.168.1.1
192.168.1.2
192.168.1.3
192.168.1.10
192.168.1.11
Subnet Mask
255.255.255.0
255.255.255.0
255.255.255.0
255.255.255.0
255.255.255.0
Default Gateway
N/A
N/A
N/A
192.168.1.1
192.168.1.1
Switch Port
S1 FA0/5
N/A
N/A
S1 FA0/6
S2 FA0/18
Objectives
Part 4: Configure SPAN and Monitor Traffic
Configure Switched Port Analyzer (SPAN).
Monitor port activity using Wireshark.
© 2016 Michael Anderson, Algonquin College Adapted from material © Cisco 2009.
Page 1 of 4
CCNA Security
Background
The Layer 2 (Data Link) infrastructure consists mainly of interconnected Ethernet switches. Most end-user
devices, such as computers, printers, IP phones and other hosts, connect to the network via Layer 2 access
switches. As a result, they can present a network security risk. Similar to routers, switches are subject to
attack from malicious internal users. The switch Cisco IOS software provides many security features that are
specific to switch functions and protocols.
In this lab [...] you use Cisco SPAN to monitor traffic to specific ports on the switch.
Note: The router commands and output in this lab are from a Cisco 1841 with Cisco IOS Release 12.4(20)T
(Advanced IP image). The switch commands and output are from a Cisco WS-C2960-24TT-L with Cisco IOS
Release 12.2(46)SE (C2960-LANBASEK9-M image). Other routers, switches, and IOS versions may be
used. See the Router Interface Summary table at the end of the lab to determine which interface identifiers to
use based on the equipment in the lab. Depending on the router or switch model and IOS version, the
commands available and output produced might vary from what is shown in this lab.
Note: Make sure that the router and the switches have been erased and have no startup configurations.
Required Resources
One router (Cisco 1841 with Cisco IOS Release 12.4(20)T1 or comparable)
Two switches (Cisco 2960 or comparable with cryptography IOS image for SSH support – Release
12.2(46)SE or comparable)
PC-A (Windows XP or Vista with a PuTTY SSH client and Wireshark)
PC-B (Windows XP or Vista with a PuTTY SSH client and SuperScan)
Ethernet cables as shown in the topology
Rollover cables to configure the switches via the console
Part 4: Configure SPAN and Monitor Traffic
Cisco IOS provides a feature that can be used to monitor network attacks called Switched Port Analyzer
(SPAN). Cisco IOS supports local SPAN and remote SPAN (RSPAN). With local SPAN, the source VLANs,
source switch ports, and the destination switch ports are on the same physical switch.
In this part of the lab, you configure a local SPAN to copy traffic from one port where a host is connected to
another port where a monitoring station is connected. The monitoring station will run the Wireshark packet
sniffer application to analyze traffic.
Note: SPAN allows you to select and copy traffic from one or more source switch ports or source VLANs onto
one or more destination ports.
All contents are Copyright © 1992–2009 Cisco Systems, Inc. All rights reserved. This document is Cisco Public Information.
Page 2 of 4
CCNA Security
Task 0: Configure the Network
Step 1: Configure the network as per the topology diagram on the first page
Task 1: Configure a SPAN Session
Step 1: Configure a SPAN session on S1 with a source and destination
a. Set the SPAN source interface using the monitor session command in global configuration mode.
The following configures a SPAN source port on FastEthernet 0/5 for ingress and egress traffic.
Traffic copied on the source port can be ingress only, egress only or both. Switch S1 port Fa0/5 is
connected to router R1, so traffic to (ingress) and from (egress) switch port Fa0/5 to R1 will be
monitored.
S1(config)#monitor session 1 source interface fa0/5 both
Note: You can specify to monitor tx (transmit) or rx (receive) traffic. The keyword both includes tx
and rx. The source can be a single interface, a range of interfaces, a single VLAN, or a range of
VLANs.
b. Set the SPAN destination interface.
S1(config)#monitor session 1 destination interface fa0/6
All traffic from S1 Fa0/5, where R1 is connected, will be copied to the SPAN destination port Fa0/6, where
PC-A with Wireshark is connected.
Note: The destination can be an interface or a range of interfaces.
Step 2: Verify the setup of the SPAN session on S1.
Confirm the SPAN session setup.
S1#show monitor session 1
Session 1
--------Type
Source Ports
Both
Destination Ports
Encapsulation
Ingress
:
:
:
:
:
Local Session
Fa0/5
Fa0/6
Native
: Disabled
Step 3: Ensure Wireshark is installed on PC-A.
a. Ensure Wireshark is installed on the PC. If not, download and install it.
Step 4: Monitor switch S1 port Fa0/5 ping activity using Wireshark on PC-A.
a. Start Wireshark.
b. From the main menu, select Capture > Interfaces.
Note: Be sure to choose all required options in order to be sure of seeing all traffic.
All contents are Copyright © 1992–2009 Cisco Systems, Inc. All rights reserved. This document is Cisco Public Information.
Page 3 of 4
CCNA Security
c.
Click the Start button for the local area network interface adapter with IP address 192.168.1.10.
d. Generate some traffic from PC-B (192.168.1.11) to R1 interface Fa0/1 (192.168.1.1) using ping. This
traffic will go from S2 port Fa0/18 to S2 port Fa0/1 across the trunk link to S1 port Fa0/1 and then exit
interface Fa0/5 on S1 to reach R1.
PC-B:\>ping 192.168.1.1
e. Observe the results in Wireshark on PC-A. You may observe an initial ARP request broadcast from
PC-B (Intel NIC) to determine the MAC address of the R1 Fa0/1 interface with IP address
192.168.1.1 and the ARP reply from the R1 Cisco Ethernet interface. After the ARP request, the
pings (echo request and replies) can be seen going from PC-B to R1 and from R1 to PC-B through
the switch.
Note: Your screen should look similar to the one below. Some additional packets might be captured
in addition to the pings, such as the R1 Fa0/1 LOOP reply.
Step 6: Dig Deeper
Make sure you dig deeper into the results. Run some "show …" commands to get extra info, capture the output
and then save it for answering potential post-lab questions!
– show the status of (all) monitoring sessions (mainly for confirmation and documentation purposes)
– show the state (brief) of all interfaces What is the SPAN destination state (up/down)?
– show the state (full details) of the SPAN destination interface What is the SPAN destination state?
– show all the dynamic entries in the MAC address table. How many exist for SPAN destination interface?
– show and record anything else that you find interesting, unusual, or unexpected.
All contents are Copyright © 1992–2009 Cisco Systems, Inc. All rights reserved. This document is Cisco Public Information.
Page 4 of 4


