AMS Weather Studies Investigations
advertisement
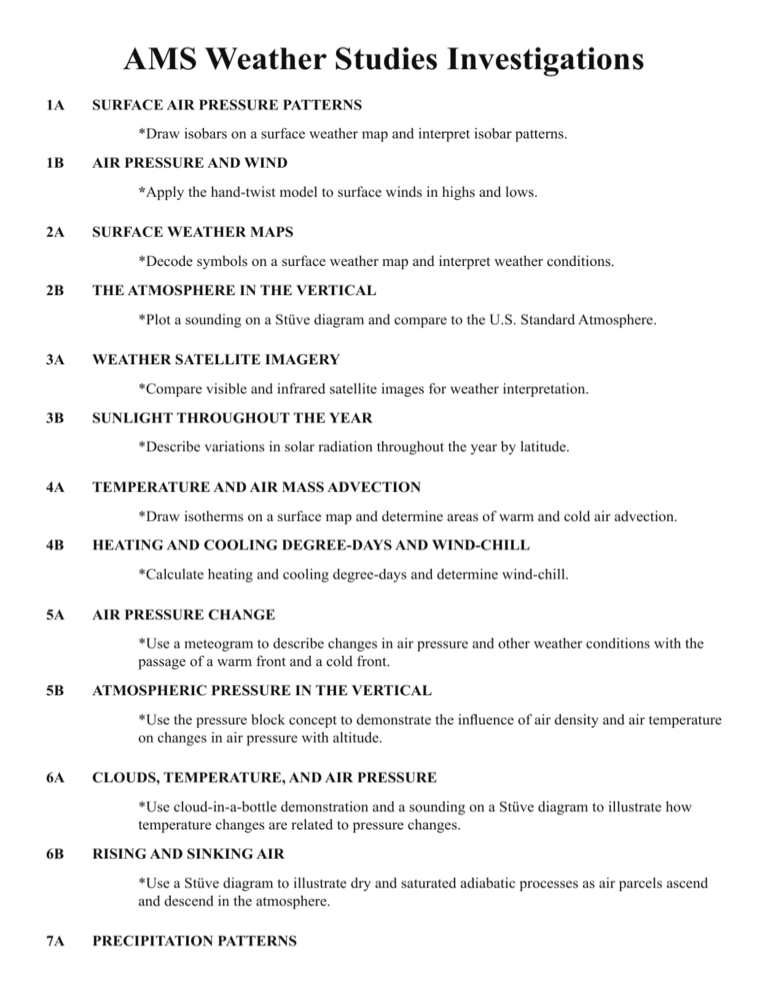
AMS Weather Studies Investigations 1A SURFACE AIR PRESSURE PATTERNS *Draw isobars on a surface weather map and interpret isobar patterns. 1B AIR PRESSURE AND WIND *Apply the hand-twist model to surface winds in highs and lows. 2A SURFACE WEATHER MAPS *Decode symbols on a surface weather map and interpret weather conditions. 2B THE ATMOSPHERE IN THE VERTICAL *Plot a sounding on a Stüve diagram and compare to the U.S. Standard Atmosphere. 3A WEATHER SATELLITE IMAGERY *Compare visible and infrared satellite images for weather interpretation. 3B SUNLIGHT THROUGHOUT THE YEAR *Describe variations in solar radiation throughout the year by latitude. 4A TEMPERATURE AND AIR MASS ADVECTION *Draw isotherms on a surface map and determine areas of warm and cold air advection. 4B HEATING AND COOLING DEGREE-DAYS AND WIND-CHILL *Calculate heating and cooling degree-days and determine wind-chill. 5A AIR PRESSURE CHANGE *Use a meteogram to describe changes in air pressure and other weather conditions with the passage of a warm front and a cold front. 5B ATMOSPHERIC PRESSURE IN THE VERTICAL *Use the pressure block concept to demonstrate the influence of air density and air temperature on changes in air pressure with altitude. 6A CLOUDS, TEMPERATURE, AND AIR PRESSURE *Use cloud-in-a-bottle demonstration and a sounding on a Stüve diagram to illustrate how temperature changes are related to pressure changes. 6B RISING AND SINKING AIR *Use a Stüve diagram to illustrate dry and saturated adiabatic processes as air parcels ascend and descend in the atmosphere. 7A PRECIPITATION PATTERNS *Locate and track areas of precipitation using weather radar operating in the reflectivity mode. 7B DOPPLER RADAR *Describe the wind pattern detected by Doppler weather radar for a severe weather situation. 8A SURFACE WEATHER MAPS AND FORCES *Examine the influence of forces on horizontal air motion near the Earth’s surface. 8B UPPER-AIR WEATHER MAPS *Describe the properties of a 500-mb map analysis and identify highs, lows, ridges, and troughs. 9A WESTERLIES AND THE JET STREAM *Examine upper-air westerly wave patterns, the jet stream, and how these features influence midlatitude surface weather. 9B ¡EL NIÑO! *Describe atmospheric and oceanic conditions that accompany periodic warmings of the tropical Pacific Ocean. 10A THE EXTRATROPICAL CYCLONE *Describe weather conditions surrounding the center of a typical extra-tropical cyclone in the midlatitudes. 10B EXTRATROPICAL CYCLONE TRACK WEATHER *Compare weather conditions on either side of an extra-tropical cyclone in the midlatitudes. 11A THUNDERSTORMS *Examine thunderstorms as they appear on visible, infrared, and water vapor satellite images. 11B TORNADOES *Determine some of the characteristics of two intense tornadoes. 12A HURRICANES *Plot a hurricane as it approaches a coastal area and assess the potential threats to life and property. 12B HURRICANE WIND SPEEDS AND PRESSURE CHANGES *Explore the relationships between central sea-level pressures and wind speeds throughout the life of a hurricane. 13A WEATHER INSTRUMENTS AND OBSERVATIONS *Explore the data provided by the Automated Surface Observing System (ASOS) and access weather observations for the U.S. and the worldvia the Internet. 13B WEATHER FORECASTS *Describe the general elements of a weather forecast and explore theNWS office forecast made available for the public. 14A ATMOSPHERIC OPTICAL PHENOMENA *Describe interactions of light with atmospheric water droplets and ice crystals and the resulting optical phenomena. 14B ATMOSPHERIC REFRACTION *Describe how refraction of light varies with solar altitude and how it affects periods of daylight. 15A VISUALIZING CLIMATE *Portray statistical climate values on a climograph and compare climographs from various locations to explore climate controls. 15B LOCAL CLIMATE DATA *Interpret data appearing in the Local Climate Data, Annual Summary With Comparative Data and determine how to access archived data.
