Homework #8:
advertisement

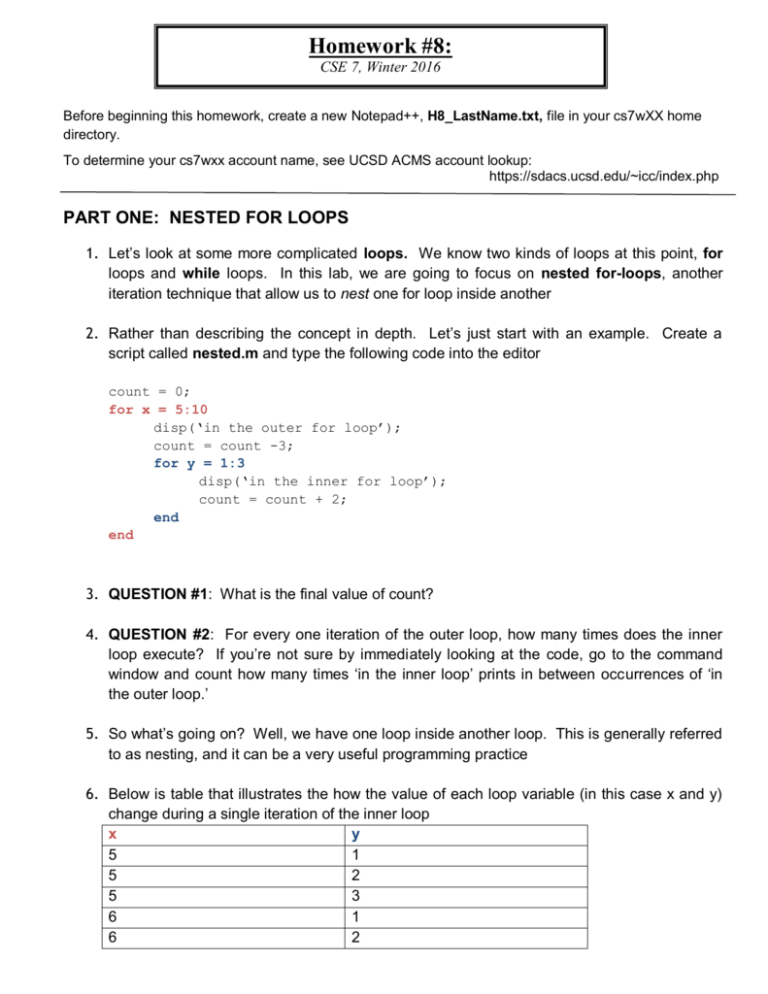
Homework #8: CSE 7, Winter 2016 Before beginning this homework, create a new Notepad++, H8_LastName.txt, file in your cs7wXX home directory. To determine your cs7wxx account name, see UCSD ACMS account lookup: https://sdacs.ucsd.edu/~icc/index.php PART ONE: NESTED FOR LOOPS 1. Let’s look at some more complicated loops. We know two kinds of loops at this point, for loops and while loops. In this lab, we are going to focus on nested for-loops, another iteration technique that allow us to nest one for loop inside another 2. Rather than describing the concept in depth. Let’s just start with an example. Create a script called nested.m and type the following code into the editor count = 0; for x = 5:10 disp(‘in the outer for loop’); count = count -3; for y = 1:3 disp(‘in the inner for loop’); count = count + 2; end end 3. QUESTION #1: What is the final value of count? 4. QUESTION #2: For every one iteration of the outer loop, how many times does the inner loop execute? If you’re not sure by immediately looking at the code, go to the command window and count how many times ‘in the inner loop’ prints in between occurrences of ‘in the outer loop.’ 5. So what’s going on? Well, we have one loop inside another loop. This is generally referred to as nesting, and it can be a very useful programming practice 6. Below is table that illustrates the how the value of each loop variable (in this case x and y) change during a single iteration of the inner loop x y 5 1 5 2 5 3 6 1 6 2 6 3 7. QUESTION #3. What is the next value that goes in the table? 8. QUESTION #4. What is the final value of x and y after all iterations of both loops have been completed? 9. QUESTION #5 How many times did the inner loop execute overall? HINT: Look at question 2. If the inner loops executes A-times in one iteration of the outer loop and you know how many times the outer loop executes, all you have to do is multiply. PART TWO: NESTED FOR LOOPS AND IMAGES 1. Let’s get back to images for a minute because they lend themselves well to understanding nested loops. 2. Imagine that we have some image, and we want to brighten it by some amount. Brightening implies increasing the RGB value of ALL the pixels by some amount. This makes sense, because if you recall, pixels whose RGB values are (255,255,255) are completely white. 3. Let’s start by creating a new function called brighten that takes in two input arguments 1. 2. filename: the name of the image we’d like to read brightness_number: the value that we’d like to increase each pixel by 4. The function has one output, a matrix that contains the newly output matrix. You may call this whatever you’d like in your code. 5. Write the function header and then add some comments explaining what the function inputs and output 6. Before, we start writing our code, let’s think about some test cases. This is called test driven development and can help us to write code with fewer bugs. 7. QUESTION #6. For each of the following lines test cases, think about what would happen and write down how you’d like our code to handle the error (if there is one). The first case is an example of a good function call that shouldn’t cause an error. NOTE: in this example our image is called “my_puppy.jpg”, but for your own example, use whatever image you want. >> brighten(‘my_puppy.jpg’, 10) >> brighten(‘my_puppy.jpg’, 256) %Why should this cause an error >> brighten(‘my_puppy.jpg’, -10) % Should this cause an error? What’s actually happening? >> brighten(imagematrix, 10) >> brighten(vector_a, 10) 8. So now that we’ve identified some potential errors, let’s check our inputs to make sure that they are the appropriate type and values before writing in the actual functionality of our code. Replace ??? with the correct values or variable name. 9. The first if statement uses the strcmp built-in function which is just like the == operator, only the == operator checks each value individually, whereas the strcmp returns 0 or 1 if the entire string matches 10. For example, ‘hello’ == ‘hellu’ would return [1 1 1 1 0] whereas strcmp(‘hello’, ‘hellu’) would just return 0 11. Now use the built-in function in MATLAB that you already know to get the number of rows and columns of image_matrix. Replace ??? with the correct values, variable name or function call. [row, cols, rgb] = ???(image_matrix) 12. Then, following the same pattern as the nested for loops in PART ONE, write a nested for loop that iterates over ALL the rows and columns and adds brightness_number to the rgb value of each pixel so that the whole image is brightened. 13. As a HINT on implementation, start by making the output variable a copy of the image_matrix variable. Then inside the inner for loop, you should have something like (assuming r and c were your loop variables): output(r,c,: ) = image_matrix(r,c,:) + brightness_number; 14. Then at the very end of your function, you can use imshow(image_matrix), open up a new figure and imshow(output) so that you show both images. 15. Make sure to you are correctly assigning a value to your output variable. 16. Test it to on an image to see if the whole image is brightened like the picture on the left. Save your original image as hw8_original.jpg and the fully brightened image as hw8_full_bright.jpg. 17. QUESTION #7: Now modify the for-loops so that only the top half is brightened (only half the rows are brightened), and then save your new image as hw8_half_bright.jpg. It should look like the image on the right. 18. QUESTION #8: What would happen if you ALSO modified your columns loop so that it only went over half the pixels? 19. QUESTION #9: How could we change our function to increase the red, green and blue values of our pixels separately, say if we wanted to increase them by different amounts? Could this be done with another nested loop? In your text file, write down a possible solution (you don’t have to implement this). PART THREE: PLOTTING COOL 3D GRAPHS WITH MESHGRID 1. MATLAB has the ability to create 3D graphs, useful for visualizing 3-dimensional data. Create a new function called MakeSurface that takes no input and returns no output. As a toy example, we will try to model our score on an upcoming quiz as a function of the number of hours we slept and the number of hours we studied. Define a vector x containing values from 1 to 8. This will represent our hours slept. Define a vector y containing values from 1 to 5. This will represent our hours studied. Use the meshgrid command to define a gridded (X,Y) domain: >> [X, Y] = meshgrid(x, y) Now let’s say we want to model our score (Z) as a function of X and Y. Let’s say we know that both sleeping and studying have diminishing returns. We can model this with a logarithmic function (remember the shape of a log function? If y = log(x), the value of y tapers off as x increases). Let’s also say that because we’ve been keeping up with lecture, we value sleep 3 times as much as studying. Let’s define our Z like this: >> Z = 3*log(X) + log(Y) Let’s plot our 3D image. Call the surf() function, giving it X, Y, and Z as input (in order!). Title your plot: ‘Surface Plot’ with the function title(). Give your x, y and z axis labels with xlabel(), ylabel, and zlabel(). NOTE: the input to these functions are the strings that you want the label to be. Your final surface plot will look similar to the image below. Save the surface plot as ‘surface.jpg’ in your cs7wXX home directory (File-->Save As) Copy and paste your MakeSurface code into QUESTION #10 QUESTION #11: Does the resulting plot make sense? What is our maximum score if we slept for only 1 hour (estimate it)? What about 8 hours of sleep and 1 hour of studying (estimate it as well)? PART FOUR: GETTING SET FOR THE FINAL LAB Next week, we are going to publish one of our MATLAB scripts. That means we are going to convert it to an html document, and then put it up on the internet. In order to put our file onto the internet, you need to first configure your school account by completing the following steps. 1. Go to https://sdacs.ucsd.edu/~icc and determine your UCSD campus wide account name and email server, if you don’t know it already. Your account should be your email address without the @ucsd.edu part. 2. Then, go to the ACS website http://acs.ucsd.edu and click “Students" on the top menu bar. 3. In the blue box on the left-hand side of your screen, select "Websites & Sharing Files" 4. Choose "Setting up a personal website" (second link down). 5. Expand “Create a “public html” directory…” and click "Home Page setup tool" (the first link under this heading) 6. Once you are on this page, you should see: 7. Two text boxes Username – enter your UCSD email address without the @ucsd.edu part Password – enter your email password A drop down box for your server – choose your email server If you were assigned "sdcc13", "sdcc15", "sdcc17", or "sdcc21", choose "acsweb" to be your server. All other servers ("ieng6" or "ieng9" for example) stay the same. 8. Two checkboxes – you want to check both of these 9. Then hit continue a. It will take some time to setup your account so be patient. When it is done, it will give you the link to your homepage, which you should bookmark in your web browser now. You will then be ready to transfer your webpage next week in LAB. PART FIVE: SAVING AND SUBMITTING SUBMIT THE FOLLOWING THINGS: 1. Notepad++ file. 2. nested.m 3. brighten.m 4. MakeSurface.m 5. All of the jpg images we asked you to submit. HOMEWORK #8 You will be graded individually. Graders will check your .m files and image files, and may ask you questions to gauge your understanding. You should have one file named “Hw8_LastName”, saved in your cs7wxx home directory. (See Homework # 1 details)


