REVIEW UNIT 10: ECOLOGY — SAMPLE
advertisement
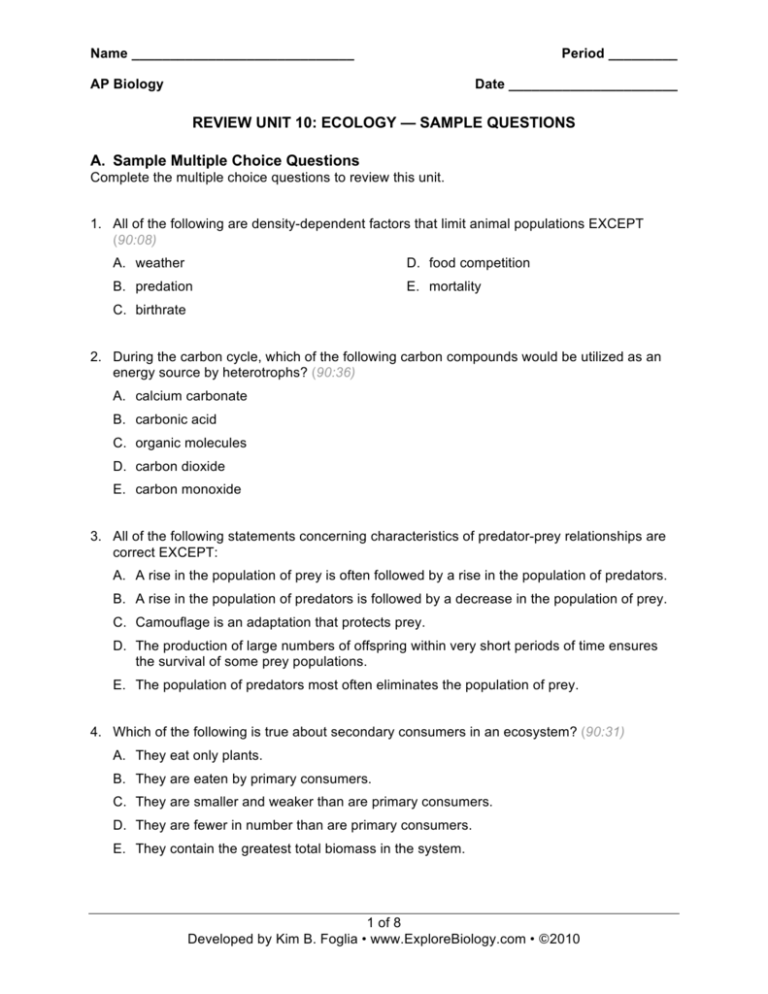
Name _____________________________ Period _________ AP Biology Date ______________________ REVIEW UNIT 10: ECOLOGY — SAMPLE QUESTIONS A. Sample Multiple Choice Questions Complete the multiple choice questions to review this unit. 1. All of the following are density-dependent factors that limit animal populations EXCEPT (90:08) A. weather D. food competition B. predation E. mortality C. birthrate 2. During the carbon cycle, which of the following carbon compounds would be utilized as an energy source by heterotrophs? (90:36) A. calcium carbonate B. carbonic acid C. organic molecules D. carbon dioxide E. carbon monoxide 3. All of the following statements concerning characteristics of predator-prey relationships are correct EXCEPT: A. A rise in the population of prey is often followed by a rise in the population of predators. B. A rise in the population of predators is followed by a decrease in the population of prey. C. Camouflage is an adaptation that protects prey. D. The production of large numbers of offspring within very short periods of time ensures the survival of some prey populations. E. The population of predators most often eliminates the population of prey. 4. Which of the following is true about secondary consumers in an ecosystem? (90:31) A. They eat only plants. B. They are eaten by primary consumers. C. They are smaller and weaker than are primary consumers. D. They are fewer in number than are primary consumers. E. They contain the greatest total biomass in the system. 1 of 8 Developed by Kim B. Foglia • www.ExploreBiology.com • ©2010 Name _____________________________ AP Biology 5. In the nitrogen cycle, the transformation of gaseous nitrogen into nitrogen-containing compounds is performed primarily by (90:35) A. fungi B. bacteria C. green plants D. herbivores E. carnivores A. tropical rain forest B. taiga C. arctic tundra D. temperate grassland E. desert 6. Permafrost; temperatures range from approximately -50°C to +25°C; a growing season of 60 days or less (90:91) 7. Over 10 inches of precipitation per year; long, cold winters and short summers; dominant vegetation is gymnosperm (90:92 modified) 8. Lack of water common in summer; seasonal temperature variations; maintained by periodic fires (90:93) 9. Less than 10 inches of precipitation per year; extremes of hot and cold throughout the year; large daily temperature variations (90:94) 10. This biome has the greatest diversity of species. (99:80) 11. Which point on the curve in the diagram above best represents the carrying capacity of the environment for the population shown. (99:01) A. A B. B C. C D. D E. E 2 of 8 Developed by Kim B. Foglia • www.ExploreBiology.com • ©2010 Name _____________________________ AP Biology Questions 12–14. refer to the food web below. (90:106-108) 12. Which of the following organisms is most likely to be located at the apex of the pyramid of biomass? (90:106) A. grass B. grasshopper C. snake D. mouse E. hawk 13. All of the following statements about the diagram are correct EXCEPT: (90:107) A. The grasshopper is an herbivore. B. Only two trophic levels are depicted. C. The mouse and grasshopper are at the same trophic level. D. The grass is a producer. E. All of the organisms except grass are consumers, regardless of position. 14. The organic and inorganic materials in all the organisms in the diagram will eventually return to the environment by the action of (90:108) A. decomposers B. producers C. primary consumers D. secondary consumers E. top carnivores 15. Which of the following best explains why there are seldom more than five trophic levels in a food chain? (94:11) A. Most carnivores function at more than one trophic level. B. Trophic levels above this number contain too many individuals. C. Top carnivores are too few in number to prey effectively. D. The ecosystem contains too much biomass. E. Energy is lost from each trophic level. 3 of 8 Developed by Kim B. Foglia • www.ExploreBiology.com • ©2010 Name _____________________________ AP Biology Questions 43–46. The illustrations below show the age and sex of the human populations in Country 1 and Country 2. The ages are grouped by 5-year classes, and the sexes are represented separately. The percentages in the different age classes are shown by the relative widths of successive horizontal bars. (94:109-112) 16. In Country 1, approximately what percentage of the individuals were younger than fifteen years of age? (94:109) A. 10% B. 21% C. 42% D. 52% E. It cannot be estimated from the graph. 17. Which of the following best approximates the ratio of males to females among individuals below fifteen years of age? (94:110) Country 1 Country 2 A. 1:1 1:1 B. 0.75 : 1 0.75 : 1 C. 0.5 : 1 0.5 : 1 D. 1:1 0.5 : 1 E. 0.75 : 1 1:1 4 of 8 Developed by Kim B. Foglia • www.ExploreBiology.com • ©2010 Name _____________________________ AP Biology 18. If, in Country 1, infant mortality declined and the birth rate remained the same, then initially the population would be expected to (94:111) A. be more evenly distributed among the age classes B. be even more concentrated in the young age classes C. stabilize at the illustrated level for all age classes D. increase in the oldest age classes E. increase in the median age classes 19. Over the next 10-15 years, the stabilization of Country 1’s population at its current size would require that (94:112) A. infant mortality be reduced to about half the present level B. the death rate be reduced drastically C. each couple produce fewer children than the number required to replace themselves D. about 15 years be added to the life expectancy of each person E. couples have an average of only 3 children Questions 20–21. The graph below shows changes in a population of wild sheep that were introduced to the island of Tasmania in the early 1800s. (99:117–120) 20. The type of population growth represented by that portion of the graph line enclosed in the bracket is most accurately termed (99:117) A. stable B. exponential C. density-dependent D. arithmetic E. decelerating 21. The graph indicates that the sheep population most likely is (99:118) A. growing in excess of its carrying capacity, since fluctuations in population size occurred after 1850 B. headed for extinction because of the population explosion about 1930 C. regulated by density-independent factors, because there appears to be about a 10-year cycle of sharp declines in size D. shifting from K-selected strategy to an r-selected strategy E. stable after 1850 under the effects of density-dependent regulating factors 5 of 8 Developed by Kim B. Foglia • www.ExploreBiology.com • ©2010 Name _____________________________ AP Biology B. Sample Free Response Questions 1. 2006:2 According to fossil records and recent published observations, two species of leaf-eating beetles (species A and B) have existed on an isolated island in the Pacific Ocean for over 100,000 years. In 1964 a third species of leaf-eating beetle (species C) was accidentally introduced on the island. The population size of each species has been regularly monitored as shown in the graph above. a. Propose an explanation for the pattern of population density observed in species C. b. Describe the effect that the introduction of beetle species C has had on the population density of species A and species B. Propose an explanation for the patterns of population density observed in species A and in species B. c. Predict the population density of species C in 2014. Provide a biological explanation for your prediction. d. Explain why invasive species are often successful in colonizing new habitats. 2. 2007:4 The energy flow in ecosystems is based on the primary productivity of autotrophs. a. Discuss the energy flow through an ecosystem and the relative efficiency with which it occurs. b. Discuss the impact of the following on energy flow on a global scale Deforestation Global climate change 6 of 8 Developed by Kim B. Foglia • www.ExploreBiology.com • ©2010 Name _____________________________ AP Biology 3. 2004:4 Organisms rarely exist alone in the natural environment. The following are five examples of symbiotic relationships. Plant root nodules Epiphytic plants Digestion of cellulose Anthrax AIDS (acquired immune deficiency syndrome) Choose FOUR of the above and for each example chosen, a. identify the participants involved in the symbiosis and describe the symbiotic relationship, and b. discuss the specific benefit or detriment, if any, that each participant receives from the relationship. 4. 2007:3 Compared with other terrestrial biomes, deserts have extremely low productivity. a. Discuss how temperature, soil composition, and annual precipitation limit productivity in deserts. b. Describe a four-organism food chain that might characterize a desert community, and identify the trophic level of each organism. c. Describe the results depicted in the graph. Explain one anatomical difference and one physiological difference between species A and B that account for the CO2 uptake patterns shown. Discuss the evolutionary significance of each difference. 7 of 8 Developed by Kim B. Foglia • www.ExploreBiology.com • ©2010 Name _____________________________ AP Biology 5. 2008:2 Consumers in aquatic ecosystems depend on producers for nutrition. a. Explain the difference between gross and net primary productivity. b. Describe a method to determine net and gross primary productivity in a freshwater pond over a 24-hour period. In an experiment, net primary productivity was measured, in the early spring, for water samples taken from different depths of a freshwater pond in a temperate deciduous forest. c. Explain the data presented by the graph, including a description of the relative rates of metabolic processes occurring at different depths of the pond. d. Describe how the relationship between net primary productivity and depth would be expected to differ if new data were collected in mid-summer from the same pond. Explain your prediction. 8 of 8 Developed by Kim B. Foglia • www.ExploreBiology.com • ©2010
