Distribution History - Tax Components for internet_Final 2014
advertisement

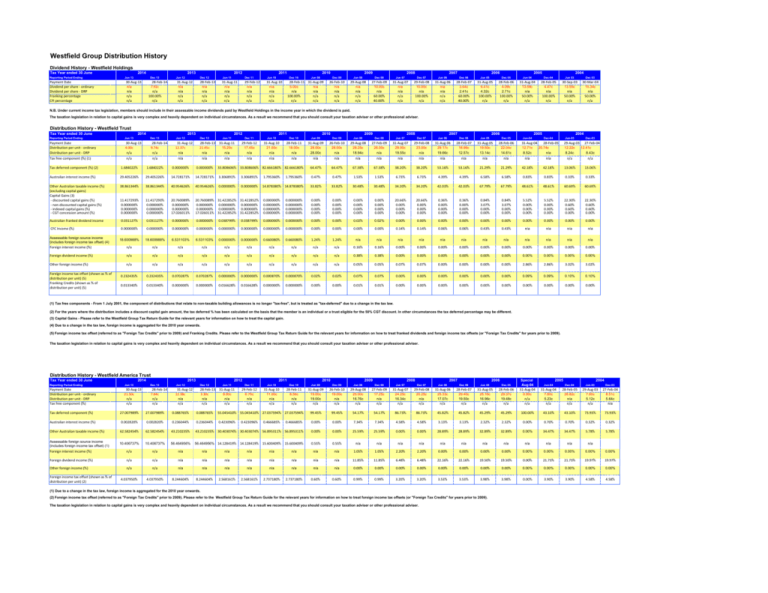
Westfield Group Distribution History Dividend History - Westfield Holdings Tax Year ended 30 June Reporting Period Ending Payment Date Dividend per share ‐ ordinary Dividend per share ‐ DRP Franking percentage CFI percentage 2013 2014 Jun 13 Dec 13 30‐Aug‐13 28‐Feb‐14 7.92c n/a 100.00% n/a n/a n/a n/a n/a Jun 12 2012 2011 2010 Dec 12 Jun 11 Dec 11 Jun 10 Dec 10 28‐Feb‐13 31‐Aug‐11 29‐Feb‐12 31‐Aug‐10 28‐Feb‐11 31‐Aug‐09 Jun 09 2009 2008 2007 2006 2005 2004 Dec 09 Jun 08 Dec 08 Jun 07 Dec 07 Jun 06 Dec 06 Jun 05 Dec 05 Jun 04 Dec-04 Jun 03 Dec 03 26‐Feb‐10 29‐Aug‐08 27‐Feb‐09 31‐Aug‐07 29‐Feb‐08 31‐Aug‐06 28‐Feb‐07 31‐Aug‐05 28‐Feb‐06 31‐Aug‐04 28‐Feb‐05 30‐Sep‐03 30‐Mar‐04 n/a n/a n/a n/a n/a n/a n/a n/a n/a n/a 5.00c n/a n/a n/a n/a n/a n/a n/a 10.00c n/a n/a n/a 10.00c n/a n/a n/a 3.64c 2.41c 6.41c 4.32c 4.09c 2.71c 13.58c n/a 4.47c n/a 13.55c n/a 15.34c n/a n/a n/a n/a n/a n/a n/a n/a n/a n/a n/a 100.00% n/a n/a n/a n/a n/a n/a n/a 60.00% 40.00% n/a n/a 100.00% n/a n/a n/a 60.00% 40.00% 100.00% n/a 100.00% n/a 50.00% n/a 100.00% n/a 50.00% n/a 50.00% n/a 31‐Aug‐12 N.B. Under current income tax legislation, members should include in their assessable income dividends paid by Westfield Holdings in the income year in which the dividend is paid. The taxation legislation in relation to capital gains is very complex and heavily dependent on individual circumstances. As a result we recommend that you should consult your taxation adviser or other professional adviser. Distribution History - Westfield Trust Tax Year ended 30 June 2014 2013 2012 Reporting Period Ending Jun 13 Dec 13 Jun 12 Dec 12 Payment Date Distribution per unit ‐ ordinary Distribution per unit ‐ DRP Tax free component (%) (1) 30‐Aug‐13 4.00c n/a n/a 28‐Feb‐14 9.74c n/a n/a 31‐Aug‐12 12.37c 28‐Feb‐13 21.45c 2011 2010 2009 2008 2007 2006 2005 Jun 11 Dec 11 Jun 10 Dec 10 Jun 09 Dec 09 Jun 08 Dec 08 Jun 07 Dec 07 Jun 06 Dec 06 Jun 05 Dec 05 31‐Aug‐11 29‐Feb‐12 31‐Aug‐10 28‐Feb‐11 31‐Aug‐09 26‐Feb‐10 29‐Aug‐08 27‐Feb‐09 31‐Aug‐07 29‐Feb‐08 31‐Aug‐06 28‐Feb‐07 31‐Aug‐05 28‐Feb‐06 Jun-04 15.20c 17.45c 21.00c 18.00c 28.00c 28.00c 28.25c 26.00c 29.00c 23.00c 29.17c 18.96c 19.50c 22.04c 12.71c 31‐Aug‐04 2004 Dec-04 Jun-03 28‐Feb‐05 29‐Aug‐03 20.74c 12.22c Dec-03 27‐Feb‐04 12.41c n/a n/a n/a n/a n/a n/a 28.00c n/a 18.94c n/a 19.55c n/a 19.66c 12.57c 13.14c 14.61c 8.52c n/a 8.24c n/a n/a n/a n/a n/a n/a n/a n/a n/a n/a n/a n/a n/a n/a n/a n/a n/a n/a n/a 8.43c n/a 64.47% 64.47% 67.38% 67.38% 38.20% 38.20% 53.16% 53.16% 21.29% 21.29% 42.18% 42.18% 13.06% 13.06% Tax deferred component (%) (2) 1.684022% 1.684022% 0.000000% 0.000000% 33.808606% 33.808606% 82.666180% 82.666180% Australian interest income (%) 29.405226% 29.405226% 14.728171% 14.728171% 3.306891% 3.306891% 1.795360% 1.795360% 0.47% 0.47% 1.53% 1.53% 6.73% 6.73% 4.39% 4.39% 6.58% 6.58% 0.83% 0.83% 0.33% 0.33% Other Australian taxable income (%) (excluding capital gains) Capital Gains (3) ‐ discounted capital gains (%) ‐ non‐discounted capital gains (%) ‐ indexed capital gains (%) ‐ CGT concession amount (%) 38.861344% 38.861344% 40.954626% 40.954626% 0.000000% 0.000000% 14.878380% 14.878380% 33.82% 33.82% 30.48% 30.48% 34.20% 34.20% 42.03% 42.03% 67.79% 67.79% 48.61% 48.61% 60.69% 60.69% 11.417293% 0.000000% 0.000000% 0.000000% 11.417293% 0.000000% 0.000000% 0.000000% 20.760089% 0.000000% 0.000000% 17.026011% 20.760089% 31.422852% 31.422852% 0.000000% 0.000000% 0.000000% 0.000000% 0.000000% 0.000000% 17.026011% 31.422852% 31.422852% 0.000000% 0.000000% 0.000000% 0.000000% 0.000000% 0.000000% 0.000000% 0.000000% 0.00% 0.00% 0.00% 0.00% 0.00% 0.00% 0.00% 0.00% 0.00% 0.00% 0.00% 0.00% 0.00% 0.00% 0.00% 0.00% 20.66% 0.00% 0.00% 0.00% 20.66% 0.00% 0.00% 0.00% 0.36% 0.00% 0.00% 0.00% 0.36% 0.00% 0.00% 0.00% 0.84% 3.07% 0.00% 0.00% 0.84% 3.07% 0.00% 0.00% 5.52% 0.00% 0.00% 0.00% 5.52% 0.00% 0.00% 0.00% 22.30% 0.60% 0.60% 0.00% 22.30% 0.60% 0.60% 0.00% Australian franked dividend income 0.031127% 0.031127% 0.000000% 0.000000% 0.038799% 0.038799% 0.000000% 0.000000% 0.00% 0.00% 0.02% 0.02% 0.00% 0.00% 0.00% 0.00% 0.00% 0.00% 0.00% 0.00% 0.00% 0.00% CFC Income (%) 0.000000% 0.000000% 0.000000% 0.000000% 0.000000% 0.000000% 0.000000% 0.000000% 0.00% 0.00% 0.00% 0.00% 0.14% 0.14% 0.06% 0.06% 0.43% 0.43% n/a n/a n/a n/a 18.600988% 18.600988% 6.531103% 6.531103% 0.000000% 0.000000% 0.660080% 0.660080% 1.24% 1.24% n/a n/a n/a n/a n/a n/a n/a n/a n/a n/a n/a n/a Foreign interest income (%) n/a n/a n/a n/a n/a n/a n/a n/a n/a n/a 0.16% 0.16% 0.00% 0.00% 0.00% 0.00% 0.00% 0.00% 0.00% 0.00% 0.00% 0.00% Foreign dividend income (%) n/a n/a n/a n/a n/a n/a n/a n/a n/a n/a 0.38% 0.38% 0.00% 0.00% 0.00% 0.00% 0.00% 0.00% 0.00% 0.00% 0.00% 0.00% Assessable foreign source income (includes foreign income tax offset) (4) Other foreign income (%) Foreign income tax offset (shown as % of distribution per unit) (5) Franking Credits (shown as % of distribution per unit) (5) n/a n/a n/a n/a n/a n/a n/a n/a n/a n/a 0.05% 0.05% 0.07% 0.07% 0.00% 0.00% 0.00% 0.00% 2.86% 2.86% 3.02% 3.02% 0.232435% 0.232435% 0.070287% 0.070287% 0.000000% 0.000000% 0.000870% 0.000870% 0.02% 0.02% 0.07% 0.07% 0.00% 0.00% 0.00% 0.00% 0.00% 0.00% 0.09% 0.09% 0.10% 0.10% 0.013340% 0.013340% 0.000000% 0.000000% 0.016628% 0.016628% 0.000000% 0.000000% 0.00% 0.00% 0.01% 0.01% 0.00% 0.00% 0.00% 0.00% 0.00% 0.00% 0.00% 0.00% 0.00% 0.00% (1) Tax free components - From 1 July 2001, the component of distributions that relate to non-taxable building allowances is no longer "tax-free", but is treated as "tax-deferred" due to a change in the tax law. (2) For the years where the distribution includes a discount capital gain amount, the tax deferred % has been calculated on the basis that the member is an individual or a trust eligible for the 50% CGT discount. In other circumstances the tax deferred percentage may be different. (3) Capital Gains - Please refer to the Westfield Group Tax Return Guide for the relevant years for information on how to treat the capital gain. (4) Due to a change in the tax law, foreign income is aggregated for the 2010 year onwards. (5) Foreign income tax offset (referred to as "Foreign Tax Credits" prior to 2009) and Franking Credits. Please refer to the Westfield Group Tax Return Guide for the relevant years for information on how to treat franked dividends and foreign income tax offsets (or "Foreign Tax Credits" for years prior to 2009). The taxation legislation in relation to capital gains is very complex and heavily dependent on individual circumstances. As a result we recommend that you should consult your taxation adviser or other professional adviser. Distribution History - Westfield America Trust 2014 Tax Year ended 30 June Jun 11 Dec 11 Jun 10 Dec 10 Jun 09 Dec 09 Jun 08 Dec 08 Jun 07 Dec 07 Jun 06 Dec 06 Jun 05 Dec 05 Special Aug-04 Jun-04 Dec-04 Jun-03 Dec-03 31‐Aug‐11 29‐Feb‐12 31‐Aug‐10 28‐Feb‐11 31‐Aug‐09 26‐Feb‐10 29‐Aug‐08 27‐Feb‐09 31‐Aug‐07 29‐Feb‐08 31‐Aug‐06 28‐Feb‐07 31‐Aug‐05 28‐Feb‐06 31‐Aug‐04 31‐Aug‐04 28‐Feb‐05 29‐Aug‐03 27‐Feb‐04 6.75c n/a 11.00c n/a 8.56c n/a 19.00c 19.00c 19.00c n/a 25.00c 16.76c 17.25c n/a 24.25c 16.34c 20.25c n/a 25.33c 17.07c 29.40c 19.50c 25.16c 16.96c 29.37c 19.48c 0.90c 26.82c n/a 7.60c 5.12c n/a n/a n/a n/a n/a n/a n/a n/a n/a n/a n/a n/a n/a n/a n/a 7.80c 5.23c n/a n/a n/a 8.51c 5.64c n/a 73.93% 2013 2012 Reporting Period Ending Jun 13 Dec 13 Jun 12 Dec 12 Payment Date Distribution per unit ‐ ordinary Distribution per unit ‐ DRP Tax free component (%) 30‐Aug‐13 21.50c n/a n/a 28‐Feb‐14 7.84c n/a n/a 31‐Aug‐12 12.38c 28‐Feb‐13 3.30c n/a n/a 9.00c n/a n/a n/a n/a 2011 2010 2009 2007 2008 2006 2005 2004 Tax deferred component (%) 27.007989% 27.007989% 0.088765% 0.088765% 55.045410% 55.045410% 27.037594% 27.037594% 99.45% 99.45% 54.17% 54.17% 86.73% 86.73% 45.82% 45.82% 45.29% 45.29% 100.00% 43.10% 43.10% 73.93% Australian interest income (%) 0.002820% 0.002820% 0.236044% 0.236044% 0.423096% 0.466685% 0.00% 0.00% 7.34% 7.34% 4.58% 4.58% 3.13% 3.13% 2.32% 2.32% 0.00% 0.70% 0.70% 0.32% 0.32% Other Australian taxable income (%) 62.582454% 62.582454% 43.210235% 43.210235% 30.403074% 30.403074% 56.895311% 56.895311% 0.00% 0.00% 25.59% 25.59% 0.00% 0.00% 28.89% 28.89% 32.89% 32.89% 0.00% 34.47% 34.47% 5.78% 5.78% Assessable foreign source income (includes foreign income tax offset) (1) 56.464956% 14.128419% 0.423096% 0.466685% 10.406737% 10.406737% 56.464956% 0.55% 0.55% n/a n/a n/a n/a n/a n/a n/a n/a n/a n/a n/a n/a Foreign interest income (%) n/a n/a n/a n/a n/a n/a n/a n/a n/a n/a 1.05% 1.05% 2.20% 2.20% 0.00% 0.00% 0.00% 0.00% 0.00% 0.00% 0.00% 0.00% 0.00% Foreign dividend income (%) n/a n/a n/a n/a n/a n/a n/a n/a n/a n/a 11.85% 11.85% 6.48% 6.48% 22.16% 22.16% 19.50% 19.50% 0.00% 21.73% 21.73% 19.97% 19.97% Other foreign income (%) Foreign income tax offset (shown as % of distribution per unit) (2) 14.128419% 15.600409% 15.600409% n/a n/a n/a n/a n/a n/a n/a n/a n/a n/a 0.00% 0.00% 0.00% 0.00% 0.00% 0.00% 0.00% 0.00% 0.00% 0.00% 0.00% 0.00% 0.00% 4.037950% 4.037950% 8.244604% 8.244604% 2.568161% 2.568161% 2.737180% 2.737180% 0.60% 0.60% 0.99% 0.99% 3.20% 3.20% 3.53% 3.53% 3.98% 3.98% 0.00% 3.90% 3.90% 4.58% 4.58% (1) Due to a change in the tax law, foreign income is aggregated for the 2010 year onwards. (2) Foreign income tax offset (referred to as "Foreign Tax Credits" prior to 2009). Please refer to the Westfield Group Tax Return Guide for the relevant years for information on how to treat foreign income tax offsets (or "Foreign Tax Credits" for years prior to 2009). The taxation legislation in relation to capital gains is very complex and heavily dependent on individual circumstances. As a result we recommend that you should consult your taxation adviser or other professional adviser.


