Lab 2: Venturi Meter
advertisement
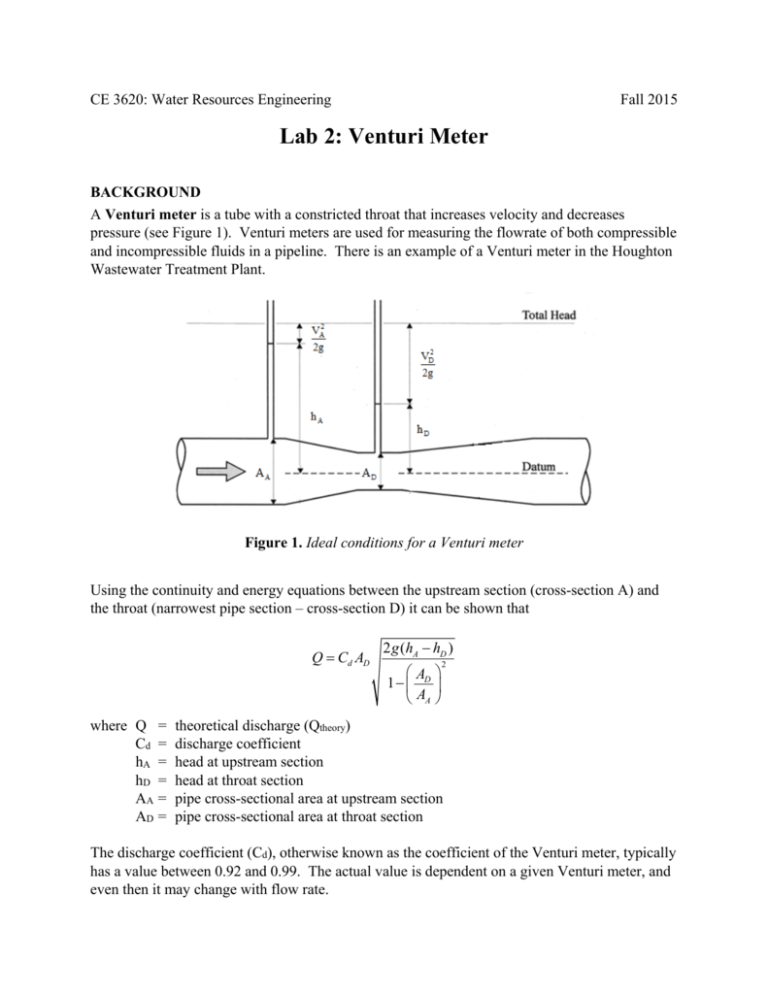
CE 3620: Water Resources Engineering Fall 2015 Lab 2: Venturi Meter BACKGROUND A Venturi meter is a tube with a constricted throat that increases velocity and decreases pressure (see Figure 1). Venturi meters are used for measuring the flowrate of both compressible and incompressible fluids in a pipeline. There is an example of a Venturi meter in the Houghton Wastewater Treatment Plant. Figure 1. Ideal conditions for a Venturi meter Using the continuity and energy equations between the upstream section (cross-section A) and the throat (narrowest pipe section – cross-section D) it can be shown that Q Cd AD where Q = Cd = hA = hD = AA = AD = 2 g (hA hD ) A 1 D AA 2 theoretical discharge (Qtheory) discharge coefficient head at upstream section head at throat section pipe cross-sectional area at upstream section pipe cross-sectional area at throat section The discharge coefficient (Cd), otherwise known as the coefficient of the Venturi meter, typically has a value between 0.92 and 0.99. The actual value is dependent on a given Venturi meter, and even then it may change with flow rate. LAB OBJECTIVES Show the relationship between flow area, pressure head, velocity head, and head loss through an expansion. Calculate the flow rate given the drop in pressure through the contraction and the area of the two cross-sections. EXPERIMENTAL PROCEDURE 1. Look at the schematic located on the back on the Venturi meter. It shows the crosssectional areas and distances to each point in the Venturi meter. Record these areas in Table 1 on the attached data sheet. 2. To adjust the flowrate for this lab, use the valve located on the Venturi meter. This will avoid introducing air into the system. Students should not change the flow rate on the hydraulic bench. 3. Shut off the flow (using the Venturi meter valve) and notice that all of the water levels in the piezometers are the same. Slowly allow flow through the system using the Venturi meter valve. Set the discharge as low as possible (water levels should be readable in all piezometers with some difference among them). Make sure that there are no air bubbles in the piezometer tubes. Record the water height in each piezometer in Table 1 (this is H for Q1). 4. Record the flow rate reported by the Mag meter in Table 2. 5. Readjust the Venturi meter valve so that the water level at cross-section D drops 1/3 the difference between the recorded value in Step 3 and 10 mm (which is the lowest readable measure on the piezometer scale). Record all water levels (H for Q2) and the discharge reported by the Mag meter. 6. Readjust the Venturi meter valve so that water level at cross-section D drops roughly the same distance as in Step 5. Record all water levels (H for Q3) and the discharge reported by the Mag meter. 7. Readjust the Venturi meter valve so that the water level at cross-section D reads closer to 10 mm. Record all water levels (H for Q4) and the discharge reported by the Mag meter. 8. For a final check, shut off the flow into the Venturi meter and make sure all of the water levels are the same. RESULTS Compare the measured flow rates (Qmag) to those calculated using the theoretical formula derived by applying the continuity and energy equations. Record measurements taken during lab in the tables provided on the attached data sheet. Type these results up in a spreadsheet and include them in the report. CALCULATIONS Show sample calculations for one flow rate (one trial) as outlined below. Label variables and use units in your calculations. Calculate the total headloss for each flow. Compute Qtheory using the equation above with Cd = 0.935. Add the appropriate values to Table 2 on the attached data sheet. Compute the values of the Hydraulic Grade Line (HGL), the Energy Grade Line (EGL) and the Total Energy Line (TEL) at each section with a piezometer for use in constructing graphs as indicated below. The HGL is the level to which the water rises in the meter. This is equivalent to the head level readings recorded in Table 1. EGL = HGL + V2/(2g) The TEL is equal to the energy (or EGL) at the upstream section. This is a constant value for a given flow rate and thus plots as a horizontal line. GRAPHS For each flow rate, plot the length (x-axis) vs. the hydraulic grade line, the energy grade line, and the total energy line (y-axis) on the same graph. Use measured data only. Also include the table of values used to construct the graph in the report. DISCUSSION 1. Do you have any suggestions for improving this apparatus? 2. How would you adjust the piezometer readings if the Venturi meter were not perfectly horizontal? If, so, what adjustments should be made? 3. What would be the procedure for determining Cd for a particular Venturi meter if you did not know it? DATA SHEET Table 1. Head values for each discharge Piezometer Diam (mm) Dist (mm) A 26.00 -54 B 23.20 -34 C 18.40 -22 D 16.00 -8 E 16.80 7 F 18.47 22 G 20.16 37 H 21.84 52 J 23.53 67 K 25.24 82 L 26.00 102 Area (mm2) H (Q1) (mm) H (Q2) (mm) H (Q3) (mm) H (Q4) (mm) Table 2. Discharge comparison Trial Qmag Qtheory 1 2 3 4 Q mag -Q theory Note: % difference=100 Q mag % difference
