PASS Sample Size Software
NCSS.com
Chapter 420
Confidence Intervals
for One Mean
Introduction
This routine calculates the sample size necessary to achieve a specified distance from the mean to the confidence
limit(s) at a stated confidence level for a confidence interval about the mean when the underlying data distribution
is normal.
Caution: This procedure assumes that the standard deviation of the future sample will be the same as the standard
deviation that is specified. If the standard deviation to be used in the procedure is estimated from a previous
sample or represents the population standard deviation, the Confidence Intervals for One Mean with Tolerance
Probability procedure should be considered. That procedure controls the probability that the distance from the
mean to the confidence limits will be less than or equal to the value specified.
Technical Details
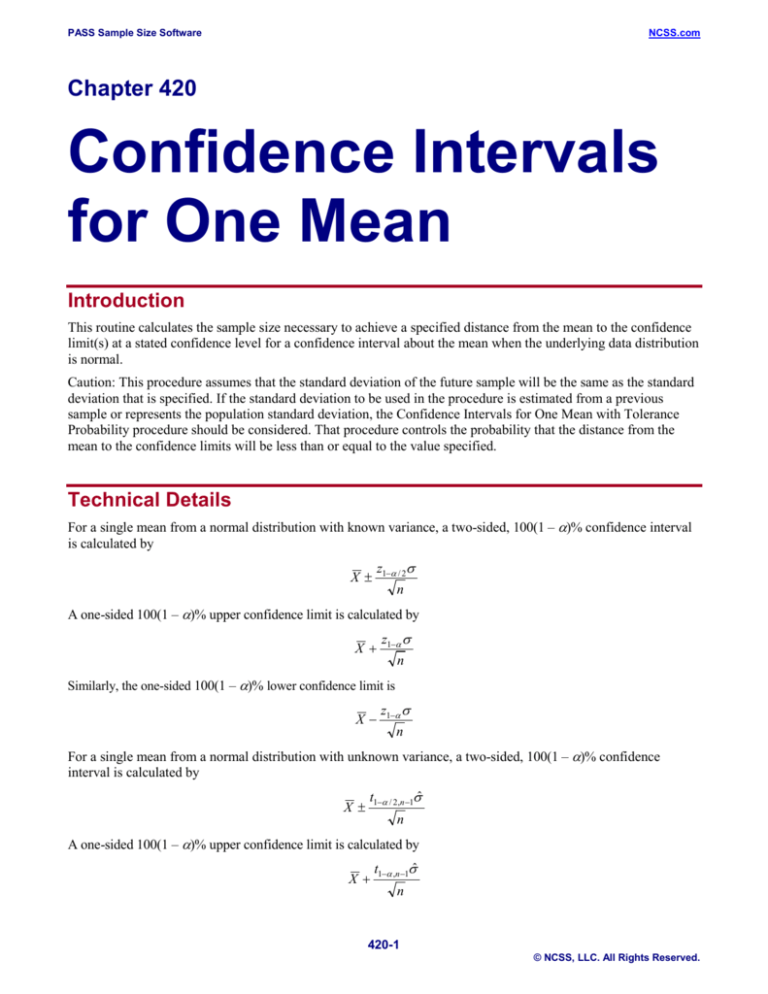
For a single mean from a normal distribution with known variance, a two-sided, 100(1 – α)% confidence interval
is calculated by
z1−α / 2σ
n
X±
A one-sided 100(1 – α)% upper confidence limit is calculated by
X+
z1−α σ
n
Similarly, the one-sided 100(1 – α)% lower confidence limit is
X−
z1−α σ
n
For a single mean from a normal distribution with unknown variance, a two-sided, 100(1 – α)% confidence
interval is calculated by
X±
t1−α / 2,n −1σˆ
n
A one-sided 100(1 – α)% upper confidence limit is calculated by
X+
t1−α ,n −1σˆ
n
420-1
© NCSS, LLC. All Rights Reserved.
PASS Sample Size Software
NCSS.com
Confidence Intervals for One Mean
Similarly, the one-sided 100(1 – α)% lower confidence limit is
X−
t1−α ,n −1σˆ
n
Each confidence interval is calculated using an estimate of the mean plus and/or minus a quantity that represents the
distance from the mean to the edge of the interval. For two-sided confidence intervals, this distance is sometimes
called the precision, margin of error, or half-width. We will label this distance, D.
The basic equation for determining sample size when D has been specified is
D=
z1−α / 2σ
n
when the standard deviation is known, and
D=
t1−α / 2, n −1σ
n
when the standard deviation is unknown. These equations can be solved for any of the unknown quantities in terms
of the others. The value α / 2 is replaced by α when a one-sided interval is used.
Finite Population Size
The above calculations assume that samples are being drawn from a large (infinite) population. When the population
is of finite size (N), an adjustment must be made. The adjustment reduces the standard deviation as follows:
σ finite = σ 1 −
n
N
This new standard deviation replaces the regular standard deviation in the above formulas.
Confidence Level
The confidence level, 1 – α, has the following interpretation. If thousands of samples of n items are drawn from a
population using simple random sampling and a confidence interval is calculated for each sample, the proportion of
those intervals that will include the true population mean is 1 - α.
Procedure Options
This section describes the options that are specific to this procedure. These are located on the Design tab. For
more information about the options of other tabs, go to the Procedure Window chapter.
Design Tab
The Design tab contains most of the parameters and options that you will be concerned with.
Solve For
Solve For
This option specifies the parameter to be solved for from the other parameters.
420-2
© NCSS, LLC. All Rights Reserved.
PASS Sample Size Software
NCSS.com
Confidence Intervals for One Mean
One-Sided or Two-Sided Interval
Interval Type
Specify whether the interval to be used will be a one-sided or a two-sided confidence interval.
Population
Population Size
This is the number of individuals in the population. Usually, you assume that samples are drawn from a very large
(infinite) population. Occasionally, however, situations arise in which the population of interest is of limited size.
In these cases, appropriate adjustments must be made. This option sets the population size.
Confidence
Confidence Level
The confidence level, 1 – α, has the following interpretation. If thousands of samples of n items are drawn from a
population using simple random sampling and a confidence interval is calculated for each sample, the proportion of
those intervals that will include the true population mean is 1 – α.
Often, the values 0.95 or 0.99 are used. You can enter single values or a range of values such as 0.90, 0.95 or 0.90
to 0.99 by 0.01.
Sample Size
N (Sample Size)
Enter one or more values for the sample size. This is the number of individuals selected at random from the
population to be in the study.
You can enter a single value or a range of values.
Precision
Distance from Mean to Limit(s)
This is the distance from the confidence limit(s) to the mean. For two-sided intervals, it is also known as the
precision, half-width, or margin of error.
You can enter a single value or a list of values. The value(s) must be greater than zero.
Standard Deviation
S (Standard Deviation)
Enter a value (or range of values) for the standard deviation. Roughly speaking, this value estimates the average
absolute difference between each individual and every other individual. You can use the results of a pilot study, a
previous study, or a ball park estimate based on the range (e.g., Range/4) to estimate this parameter.
Know Standard Deviation
Check this box when you want to base your results on the normal distribution. When the box is not checked,
calculations are based on the t-distribution. The difference between the two distributions is negligible when the
sample sizes are large (>50).
420-3
© NCSS, LLC. All Rights Reserved.
PASS Sample Size Software
NCSS.com
Confidence Intervals for One Mean
Example 1 – Calculating Sample Size
Suppose a study is planned in which the researcher wishes to construct a two-sided 95% confidence interval for
the mean such that the width of the interval is no wider than 14 units. The confidence level is set at 0.95, but 0.99
is included for comparative purposes. The standard deviation estimate, based on the range of data values, is 28.
Instead of examining only the interval half-width of 7, a series of half-widths from 5 to 9 will also be considered.
The goal is to determine the necessary sample size.
Setup
This section presents the values of each of the parameters needed to run this example. First, from the PASS Home
window, load the Confidence Intervals for One Mean procedure window by expanding Means, then One
Mean, then clicking on Confidence Interval, and then clicking on Confidence Intervals for One Mean. You
may then make the appropriate entries as listed below, or open Example 1 by going to the File menu and
choosing Open Example Template.
Option
Value
Design Tab
Solve For ................................................ Sample Size
Interval Type ........................................... Two-Sided
Population Size ....................................... Infinite
Confidence Level .................................... 0.95 0.99
Distance from Mean to Limit(s) ............... 5 to 9 by 1
S (Standard Deviation) ........................... 28
Known Standard Deviation ..................... Not Checked
Annotated Output
Click the Calculate button to perform the calculations and generate the following output.
Numeric Results
Numeric Results for Two-Sided Confidence Intervals with Unknown Standard Deviation
Confidence
Level
0.950
0.990
0.950
0.990
0.950
0.990
0.950
0.990
0.950
0.990
Sample
Size
(N)
123
212
87
149
64
110
50
86
40
69
Target
Distance
from Mean
to Limits
5.000
5.000
6.000
6.000
7.000
7.000
8.000
8.000
9.000
9.000
Actual
Distance
from Mean
to Limits
4.998
4.999
5.968
5.986
6.994
6.999
7.958
7.956
8.955
8.933
Standard
Deviation
(S)
28.000
28.000
28.000
28.000
28.000
28.000
28.000
28.000
28.000
28.000
References
Hahn, G. J. and Meeker, W.Q. 1991. Statistical Intervals. John Wiley & Sons. New York.
420-4
© NCSS, LLC. All Rights Reserved.
PASS Sample Size Software
NCSS.com
Confidence Intervals for One Mean
Report Definitions
Confidence level is the proportion of confidence intervals (constructed with this same confidence level,
sample size, etc.) that would contain the population mean.
N is the size of the sample drawn from the population.
Distance from Mean to Limit is the distance from the confidence limit(s) to the mean. For two-sided intervals,
it is also know as the precision, half-width, or margin of error.
Target Distance from Mean to Limit is the value of the distance that is entered into the procedure.
Actual Distance from Mean to Limit is the value of the distance that is obtained from the procedure.
The standard deviation of the population measures the variability in the population.
Summary Statements
A sample size of 123 produces a two-sided 95% confidence interval with a distance from the mean
to the limits that is equal to 4.998 when the estimated standard deviation is 28.000.
This report shows the calculated sample size for each of the scenarios.
Chart Section
These plots show the sample size versus the distance from the mean to the limits (precision) for the two
confidence levels.
420-5
© NCSS, LLC. All Rights Reserved.
PASS Sample Size Software
NCSS.com
Confidence Intervals for One Mean
Example 2 – Validation using Moore and McCabe
Moore and McCabe (1999) page 443 give an example of a sample size calculation for a confidence interval on the
mean when the confidence coefficient is 95%, the standard deviation is known to be 3, and the margin of error is
2. The necessary sample size is 9.
Setup
This section presents the values of each of the parameters needed to run this example. First, from the PASS Home
window, load the Confidence Intervals for One Mean procedure window by expanding Means, then One
Mean, then clicking on Confidence Interval, and then clicking on Confidence Intervals for One Mean. You
may then make the appropriate entries as listed below, or open Example 2 by going to the File menu and
choosing Open Example Template.
Option
Value
Design Tab
Solve For ................................................ Sample Size
Interval Type ........................................... Two-Sided
Population Size ....................................... Infinite
Confidence Level .................................... 0.95
Distance from Mean to Limit(s) ............... 2
S (Standard Deviation) ........................... 3
Known Standard Deviation ..................... Checked
Output
Click the Calculate button to perform the calculations and generate the following output.
Numeric Results
Confidence
Level
0.95
Sample
Size
(N)
9
Target
Distance
from Mean
to Limits
2.000
Actual
Distance
from Mean
to Limits
1.960
Standard
Deviation
(S)
3.000
PASS also calculated the necessary sample size to be 9.
420-6
© NCSS, LLC. All Rights Reserved.
PASS Sample Size Software
NCSS.com
Confidence Intervals for One Mean
Example 3 – Validation using Ostle and Malone
Ostle and Malone (1988) page 536 give an example of a sample size calculation for a confidence interval on the
mean when the confidence coefficient is 95%, the standard deviation is known to be 7, and the margin of error is
5. The necessary sample size is 8.
Setup
This section presents the values of each of the parameters needed to run this example. First, from the PASS Home
window, load the Confidence Intervals for One Mean procedure window by expanding Means, then One
Mean, then clicking on Confidence Interval, and then clicking on Confidence Intervals for One Mean. You
may then make the appropriate entries as listed below, or open Example 3 by going to the File menu and
choosing Open Example Template.
Option
Value
Design Tab
Solve For ................................................ Sample Size
Interval Type ........................................... Two-Sided
Population Size ....................................... Infinite
Confidence Level .................................... 0.95
Distance from Mean to Limit(s) ............... 5
S (Standard Deviation) ........................... 7
Known Standard Deviation ..................... Checked
Output
Click the Calculate button to perform the calculations and generate the following output.
Numeric Results
Confidence
Level
0.95
Sample
Size
(N)
8
Target
Distance
from Mean
to Limits
5.000
Actual
Distance
from Mean
to Limits
4.851
Standard
Deviation
(S)
7.000
PASS also calculated the necessary sample size to be 8.
420-7
© NCSS, LLC. All Rights Reserved.


