Water Cooling Tower Experiment: Principles & Performance
advertisement
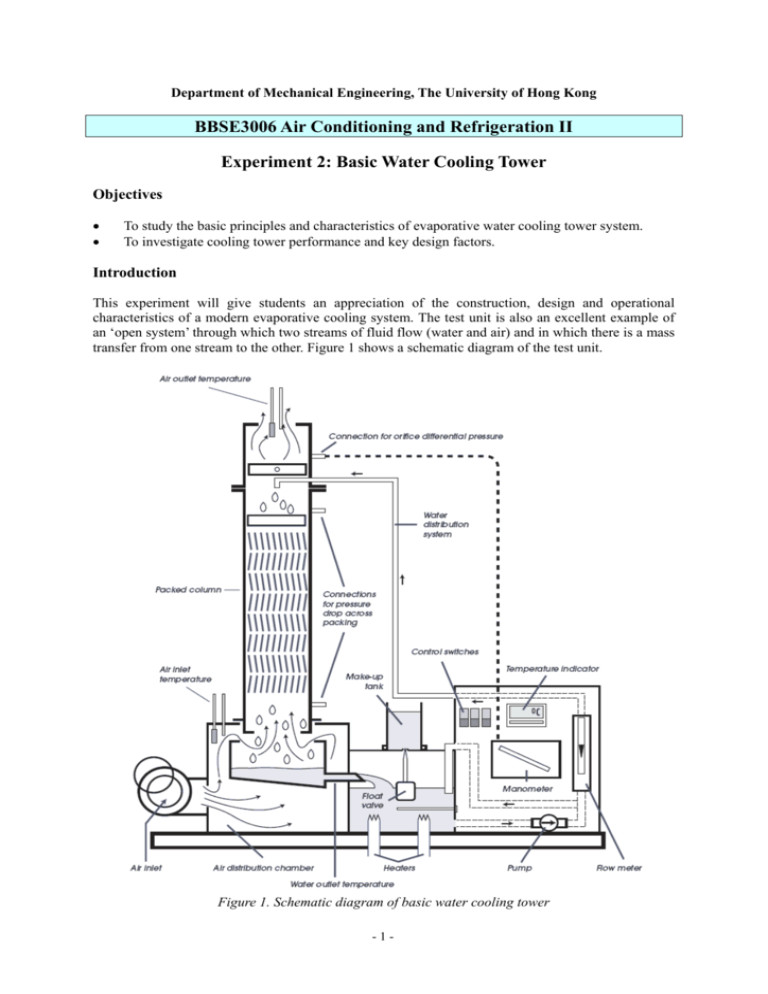
Department of Mechanical Engineering, The University of Hong Kong BBSE3006 Air Conditioning and Refrigeration II Experiment 2: Basic Water Cooling Tower Objectives To study the basic principles and characteristics of evaporative water cooling tower system. To investigate cooling tower performance and key design factors. Introduction This experiment will give students an appreciation of the construction, design and operational characteristics of a modern evaporative cooling system. The test unit is also an excellent example of an ‘open system’ through which two streams of fluid flow (water and air) and in which there is a mass transfer from one stream to the other. Figure 1 shows a schematic diagram of the test unit. Figure 1. Schematic diagram of basic water cooling tower -1- Theory and Principles The Basic Water Cooling Tower behaves in a similar manner and has similar components to a full size cooling tower. (a) Cooling tower terms Cooling range Cooling load Make-up Drift or carry out Packing or fill Approach to wet bulb Drain down The difference between the water temperature at entry to and exit from the tower. The rate at which heat is removed from the water. This may be expressed in kW, Btu/h or kCal/h. The quantity of fresh water which must be supplied to the water circuit to make good the losses due to evaporation and other causes. Droplets of water which are entrained by the air stream leaving the tower. The material over which the water flows as it falls through the tower, so that a large surface area is presented to the air stream. The difference between the temperature of the water leaving the tower and the wet bulb temperature of the air entering. Water deliberately removed from the water system to prevent the excessive concentration of dissolved solids (due to evaporation) and sludge (due to impurities from the atmosphere). (b) Basic principles Consider the surface of a warm water droplet or film in contact with an air stream (see Figure 2). Figure 2. Basic principles of heat and mass transfer of water cooling tower Assuming that the water is hotter than the air, it will be cooled: i) ii) iii) (c) By radiation – This effect is likely to be very small under normal condition, and may be neglected. By conduction and convection – This will depend on the temperature difference, the surface area, air velocity, etc. By evaporation – This is by far the most important effect. Cooling takes place as molecules of H2O diffuse from the surface into the surrounding air. These molecules are then replaced by others from the liquid (evaporation) and the energy required for this is taken from the remaining liquid. Evaporation from a wet surface The rate of evaporation from a wet surface into the surrounding air is determined by the difference -2- between the vapour pressure at the liquid surface, i.e. the saturation pressure corresponding with the surface temperature, and the vapour pressure in the surrounding air. The latter is determined by the total pressure of the air and its absolute humidity. In an enclosed space, evaporation can continue until two vapor pressure are equal, i.e. until the air is saturated and at the same temperature as the surface. However, if unsaturated air is constantly circulated, the wet surface will reach an equilibrium temperature at which the cooling effect due to the evaporation is equal to the heat transfer to the liquid by conduction and convection from the air, which under these conditions will be at a higher temperature. The equilibrium temperature reached by the surface under adiabatic conditions (i.e. in the absence of external heat gains or losses), is the “wet bulb temperature”. In a cooling tower of infinite size and with an adequate air flow, the water leaving will be at the wet bulb temperature of the incoming air. For this reason, the difference between the temperature of the water leaving a cooling tower and the local wet bulb temperature is an indication of the effectiveness of the cooling tower. The “Approach to Wet Bulb” is one of the important parameters in the testing, specification, design and selection of the cooling tower. (d) Steady flow energy equation Before the equation is applied, the cooling tower system must be defined: Heat transferred at the load tank, i.e. the process load, and possibly a small quantity to the surroundings (Q). Work is transferred at the pump (P). Low humidity air enters at the air inlet at A. High humidity air leaves at the air outlet at B. Make-up (equal to the increase of moisture in the air stream) enters at the make-up tank at E. From the steady flow equation, expressing the thermal energy or heat (H) at exit and entry: Q – P = HExit – HEntry = (ma hda + ms hs)B – (ma hda + ms hs)A – mE hE (1) Note: The pump power P is –ve since it is a work input. Subscript “da” is for dry air; “s” for water vapour (or steam). If the enthalpy of air includes the enthalpy of the steam associated with it, and this quantity is expressed per unit mass of dry air, the equation may be written as follows: Q – P = ma (hB – hA) – mE hE (2) The mass flow rate of dry air (ma) through a cooling tower is a constant, whereas the mass flow rate of moist air due to evaporation of some of the water. In fact, the term mE hE is usually small compared with other terms and is often neglected. (e) Mass balance By conservation of mass, under steady state conditions, the mass flow rate of dry air and of H2O (as liquid or vapour) must be the same at inlet and outlet to any system. Thus, for dry air, (ma)A = (ma)B and for H2O, (ms)A + mE = (ms)B mE = (ms)B – (ms)A (3) -3- The ratio of steam to air (ω) is known for the initial and final state points on the psychrometric chart. Thus, (ms)B = ma ωB and (ms)A = ma ωA mE = ma (ωB – ωA) (4) The system may be re-defined thus. In this case, the process heat and pump work does not cross the boundary of the system, but we now have warm water entering the system at C and cool water leaving at D. Applying the steady flow energy equation, Q – P = HExit – HInlet Assume P = 0; Q may have a small value due to heat transfer between the unit and its surroundings. Q = ma hB + mw hD – (ma hA + mw hC + mE hE) = ma (hB – hA) + mw (hD –hC) – mE hE = ma (hB – hA) + mw cp (tD –tC) – mE hE (5) As stated earlier, the term mE hE is usually small compared with the other terms. cp is the specific heat capacity of water (4.18 kg-1 K-1) and t is the water temperature. Equipment and Instruments Basic Water Cooling Tower unit Packing installed: B Packing density: 110 m2 per m3 Measuring instruments for dry bulb and wet bulb temperatures Procedure The cooling tower unit should be prepared, started and allowed to stabilise under the following suggested conditions: Water flow rate = 40 g s-1 Orifice differential = 16 mm H2O Cooling load = 0 kW Note: Stability is reached when there is no further appreciable change in temperature or flow rate. After the conditions have stabilised, observe and examine the processes of the water system and air system of the cooling tower. At regular intervals over a measured period of time, say 10 minutes, all temperatures and flow rates should be noted and the mean values entered on the observation chart. At the commencement of this period, fill the make-up tank to the gauge mark with distilled water. At the end of this period, refill the tank from a known quantity of distilled water in a measuring cylinder. By difference, determine the quantity of make-up which has been supplied in the time interval. While keeping the water and air flows constant, the cooling load should be increased to 0.5 kW. When the conditions have stabilised the observations should be repeated. -4- Similar tests should be made with cooling loads of 1.0 and 1.5 kW. From the results, investigate the effect of cooling load on approach to wet bulb. Results A form is provided in the Appendix for recording the measurement data. After the experiment, the following information should be established to report the findings. Clear presentation of the measurement data Determination of the state properties of air and H2O from tables or charts Calculations to draw up energy and mass balances Analysis of the relationship between cooling load and approach to wet bulb temperature Discussions The following issues shall be evaluated and discussed. Factors affecting the accuracy of the measurements Major design factors and issues affecting cooling tower performance Laboratory Report Each student should prepare their own report based on the data and information obtained during the experiment. While the results from the observations and measurements can be shared among the members in the same student group, each student shall generate information to show his/her own understanding and ideas. Students making direct copy of the information in other’s report (plagiarism), if found, will be disqualified. The laboratory report shall be submitted to the lecturer within FOUR weeks after completion of the experiment. Late submission will receive reduction in marks. Submitting either printed copy or electronic copy of the report is acceptable. References AIRAH, 1997. Cooling Towers, Australian Institute of Refrigeration, Air-Conditioning and Heating (AIRAH) in association with The Institute of Refrigeration Heating and Air Conditioning Engineers of New Zealand, West Melbourne, Victoria. [P 697.9322 C77] ASHRAE, 2008. ASHRAE Systems and Equipment Handbook 2008, SI edition, Chp. 39: Cooling Towers, American Society of Heating, Refrigerating, and Air-Conditioning Engineers, Atlanta, GA. Burger, R., 1995. Cooling Tower Technology: Maintenance, Upgrading, and Rebuilding, 3rd ed., Fairmont Press, Lilburn, GA. [621.197 B9] Stanford, H. W., 2003. HVAC Water Chillers and Cooling Towers: Fundamentals, Application, and Operation, Marcel Dekker, Inc., New York. [697.9322 S7] [www.crcnetbase.com/isbn/9780203912492] Web Links Cooling tower – Wikipedia, http://en.wikipedia.org/wiki/Cooling_tower Revised Oct 2010 -5- Appendix Basic Water Cooling Tower Observation Sheet Date:_______________ Investigation:_____________________ Test No. 1 2 Packing Installed Packing Density Air Inlet Dry Bulb Air Inlet Wet Bulb Air Outlet Dry Bulb Air Outlet Wet Bulb Water Inlet Temperature Water Outlet Temperature Water Make-up Temperature* Orifice Differential Water Flow Rate Cooling Load Make-up Quantity Time Interval Pressure Drop Across Packing m2 per m3 t1 (°C) t2 (°C) t3 (°C) t4 (°C) t5 (°C) t6 (°C) t7 (°C) x (mm H2O) mw (g s-1) Q (kW) mE (kg) y (s) Δp (mm H2O) * Assumed to be the same as ambient dry bulb temperature t1. -6- Atmospheric Pressure:________ 3 4 5
