Crude Oil, Gold, and Silver Trio
advertisement
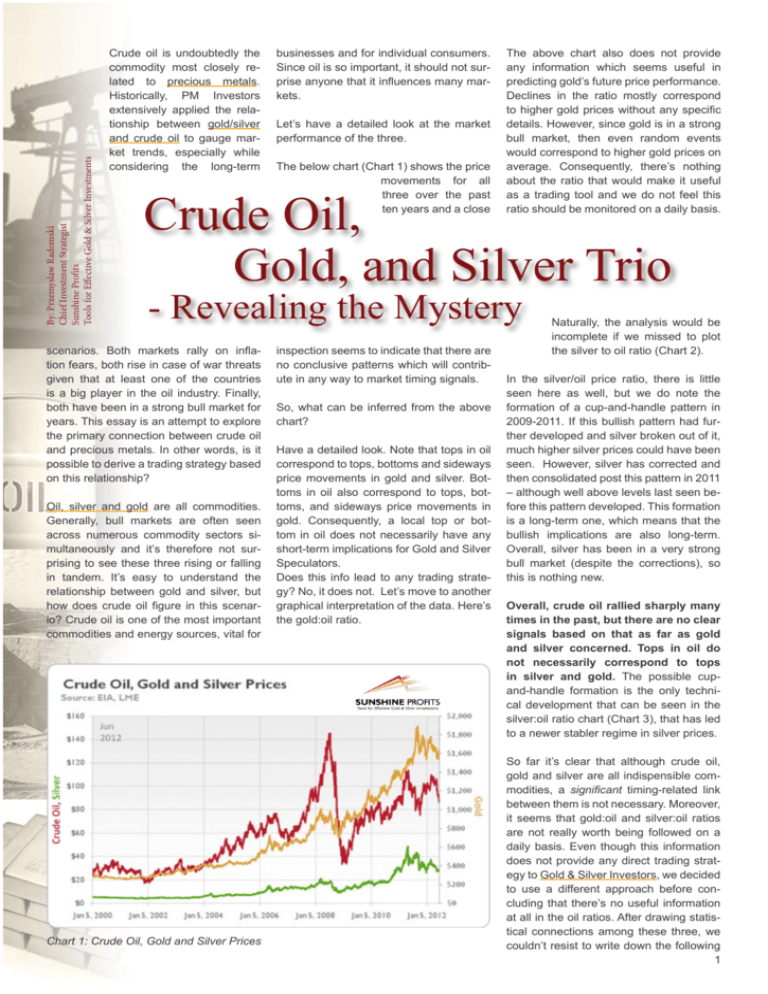
By: Przemyslaw Radomski Chief Investment Strategist Sunshine Profits Tools for Effective Gold & Silver Investments Crude oil is undoubtedly the commodity most closely related to precious metals. Historically, PM Investors extensively applied the relationship between gold/silver and crude oil to gauge market trends, especially while considering the long-term businesses and for individual consumers. Since oil is so important, it should not surprise anyone that it influences many markets. Let’s have a detailed look at the market performance of the three. The below chart (Chart 1) shows the price movements for all three over the past ten years and a close The above chart also does not provide any information which seems useful in predicting gold’s future price performance. Declines in the ratio mostly correspond to higher gold prices without any specific details. However, since gold is in a strong bull market, then even random events would correspond to higher gold prices on average. Consequently, there’s nothing about the ratio that would make it useful as a trading tool and we do not feel this ratio should be monitored on a daily basis. Crude Oil, Gold, and Silver Trio - Revealing the Mystery scenarios. Both markets rally on inflation fears, both rise in case of war threats given that at least one of the countries is a big player in the oil industry. Finally, both have been in a strong bull market for years. This essay is an attempt to explore the primary connection between crude oil and precious metals. In other words, is it possible to derive a trading strategy based on this relationship? Oil, silver and gold are all commodities. Generally, bull markets are often seen across numerous commodity sectors simultaneously and it’s therefore not surprising to see these three rising or falling in tandem. It’s easy to understand the relationship between gold and silver, but how does crude oil figure in this scenario? Crude oil is one of the most important commodities and energy sources, vital for Chart 1: Crude Oil, Gold and Silver Prices inspection seems to indicate that there are no conclusive patterns which will contribute in any way to market timing signals. So, what can be inferred from the above chart? Have a detailed look. Note that tops in oil correspond to tops, bottoms and sideways price movements in gold and silver. Bottoms in oil also correspond to tops, bottoms, and sideways price movements in gold. Consequently, a local top or bottom in oil does not necessarily have any short-term implications for Gold and Silver Speculators. Does this info lead to any trading strategy? No, it does not. Let’s move to another graphical interpretation of the data. Here’s the gold:oil ratio. Naturally, the analysis would be incomplete if we missed to plot the silver to oil ratio (Chart 2). In the silver/oil price ratio, there is little seen here as well, but we do note the formation of a cup-and-handle pattern in 2009-2011. If this bullish pattern had further developed and silver broken out of it, much higher silver prices could have been seen. However, silver has corrected and then consolidated post this pattern in 2011 – although well above levels last seen before this pattern developed. This formation is a long-term one, which means that the bullish implications are also long-term. Overall, silver has been in a very strong bull market (despite the corrections), so this is nothing new. Overall, crude oil rallied sharply many times in the past, but there are no clear signals based on that as far as gold and silver concerned. Tops in oil do not necessarily correspond to tops in silver and gold. The possible cupand-handle formation is the only technical development that can be seen in the silver:oil ratio chart (Chart 3), that has led to a newer stabler regime in silver prices. So far it’s clear that although crude oil, gold and silver are all indispensible commodities, a significant timing-related link between them is not necessary. Moreover, it seems that gold:oil and silver:oil ratios are not really worth being followed on a daily basis. Even though this information does not provide any direct trading strategy to Gold & Silver Investors, we decided to use a different approach before concluding that there’s no useful information at all in the oil ratios. After drawing statistical connections among these three, we couldn’t resist to write down the following 1 took a larger time-frame into account. In July 2008 prices of crude oil attained an all-time high and many precious metals investors were bothered by the fact that gold and silver had not followed crude oil’s steps very closely. (In fact, this chart indicates the state just after crude witnessed its all-time peak in history!) Chart 2: Gold/ Oil Ratio vs. Gold sections. Gold, Silver and Oil – Alternative Approach One of the best ways to view any significant events or price patterns is to take a look at the big picture to see whether or not the situation is indeed extraordinary and should really put you on alert. Day to day volatile price swings, short-term trades, hundreds of important headlines in the mainstream press – they all make us perceive markets emotionally, rather than approach them by means of cold logic. The latter usually leads us to better investment decisions than the former. If one can look at the big picture from a different perspective or angle then it’s even better. Keeping that in mind, we checked if something similar has happened in the past and if so, what was the final outcome. That outcome could provide indication of what to expect in the near future. Chart 3: Silver/Oil Ration vs. Silver We have prepared 4 charts with gold and crude oil in two different scales: logarithmic and linear. Since we are talking about rather long term trends and relations, we will first present chart in the logarithmic scale, as it emphasizes growth in percentage terms. This makes it very useful if prices increase substantially. This is one of the charts (data: 2000-2008) that were used to illustrate the relation between gold and oil (Chart 4). With the help of this chart, we would like to move to another related topic. If we say, the above chart emphasizes the fact that gold and oil undergo the process of relative over- and under- valuation, what would be your response? This phenomenon would be even more visible if one First things first – there is a massive longterm uptrend in both gold and oil, which has not been violated up to date. Next, gold and oil tend to rise at the same time in the long term. The linear trend line with a positive slope and the R-square coefficient of 89% suggests that this is relatively stable type of correlation. Please note that we have highlighted the phrase in the long term. We have done so, because there were short periods, when oil surged independently from gold, and there were times when profits achieved on gold were superior to those that could have been achieved on crude oil. We are not taking any leverage into account here, just the spot prices. Generally, one can distinguish two general trend lines – borders of the rising trend channel. Price of gold relative to crude oil used to touch both of these trend lines in the past. These times could have been described as ‘critical underperformance’. Should gold fall substantially below the lower trend line, we would start to worry about the healthiness of the precious metals bull market; however this has not materialized in this chart. According to the trend lines, gold is undervalued relative to crude oil, but it is still way above the level of ‘critical underperformance’. This suggests gold’s rather sluggish performance relative to oil. However before underscoring this, we have a second chart (Chart 5) to show you. It is created using the same data but this time, we used the linear scale (please note that the last data used in below graph is July 15, 2008, just after crude witnessed the all-time peak). This time the chart does not give a clear picture when it comes to drawing a trend channel, but it tells more about the shape of the correlation. As you may see, there have been many days, where price of gold was trading between $400 and $500 level, while the price of oil traded between $30 and $70 level. Taking into account these levels and the days in which they materialized, gold increased by a solid 25%, while oil increased more than 100% (as of July 15, 2008). That is what we previously referred to as the ‘critical underper2 time, and in the following part of the essay we would like to focus on the way investors can take advantage of it. Gold and Crude Oil - Logarithmic Scale $1,200 As mentioned in the initial paragraphs of this essay, crude oil has many uses, but since transport is crude-oil-dependent, high crude oil prices mean higher costs for all companies. Even if a company doesn’t transport anything directly, it will suffer from higher cost of paper, tools etc., as wood, steel, etc. that were used to produce it, had to be transported several times before the final product was sold. Mining companies are no exception. Jul 15, 2008 $900 $600 $400 y = 7.038x + 114.44 R² = 0.8907 $200 $30 $50 $70 Chart 4: Gold and Crude Oil - Logarithmic Scale formance’. But what had happened afterwards? Had the gold bull ended? No, it had not. On the contrary, as the commodities and precious metals bull market continued, gold has managed to rebound and jump back above the trend line. Should that take place with the trend line and the price of oil of $150, gold would have to go above $1170. It was close to three years ago, when gold was rather undervalued to oil, and now the tables have turned. If one would put today’s gold/oil price combination on the above chart, they would get a point which is way above the trend channel. We updated the data so that it reflects also recent price combinations – please take a look at the following charts: first one in the logarithmic scale at Chart 6. Also, compare the two commodities in linear scale at Chart 7. Today’s price combination is indeed way above the trend line, which is an unprecedented event during a bull market. However, most of us will agree that these are not ordinary times. Recently, most commodities (except gold, of course) reacted to the deflation scare that was being hyped by the media. We do not say that this was done on purpose so that the powers that be could get away with printing more and more money, but that is definitely a food for thought. It is important to realize that (contrary to what is often believed) there is also another way to define inflation/deflation, besides “rising/falling prices”. In fact, deflation/inflation is the decrease/increase in the prices of goods caused by the $90 $110 $130 $150 changes in the money supply. If you take this definition into account, we are definitely in the inflationary period, as the amounts of money that were created recently out of thin air are enormous. We prefer to use the latter definition, as it is confirmed by statistics, history, and basic economic laws. Statistics show that there is a very high correlation between rising prices and the money supply, which is caused by very basic law of supply and demand. Supply of money increases so its price/value decreases - and since the currency’s value is lower, then goods price in it will seem to cost more in the long term. The deflationary scare will not last forever, as ultimately people will wake up to the fact that prices on average are going up, not down. It will most likely take some Higher crude oil prices mean higher costs for mining companies. Higher costs translate into lower profits. Lower profits ultimately lead to lower stock values. Naturally, the same works the other way around. Of course there are things like oil reserves and so on, but that fact does not invalidate the entire mechanism. It makes precious metals stocks react only to longterm changes of crude oil’s price. On the other hand gold is the general proxy for gold stock’s revenues. Since the HUI Index consists of gold stocks that do not hedge their gold production beyond 1.5 years, it is obvious that the price of gold has a direct influence on these companies’ earnings and thus share prices. Based on the information from the above paragraph, one might infer that the Gold/ Oil ratio should trade rather in tune with the HUI Index. After all, both: higher gold prices and lower crude oil prices mean higher Gold/Oil ratio. Please take a look at the below chart for details (Chart 8). Gold and Crude Oil - Linear Scale $1,200 Jul 15, 2008 $1,000 $800 $600 $400 y = 7.038x + 114.44 R² = 0.8907 $200 $15 $35 $55 $75 $95 $115 $135 $155 Chart 5: Gold and Crude Oil - Linear Scale 3 At the first sight, the chart might be perplexing, as the HUI Index has been rising rather consequently (until the carnage in 2008), while the Gold/Oil ratio has been on an overall downtrend until oil prices skyrocketed in 2008. However, if one takes into account the changes in the direction of both lines, the ratio’s influence becomes visible. From the long-term perspective one can see that gold stocks were rising, consolidating, rising, consolidating, and so on. What is interesting here is that the consolidation in the gold stock sector took place when the Gold / Oil ratio was declining. Conversely, during Gold/ Oil Ratio upswings, HUI rallied. No wonder - gold is a proxy for revenues and oil is proxy for costs (machinery, transport), so if revenues rise faster than costs the profits rise and stock price eventually follows. Chart 6: Gold and Crude Oil - Logarithmic Scale Crude Oil and Gold - Linear Scale $1,600 Apr 14, 2011 $1,400 $1,200 $1,000 $800 $600 $400 y = 9.8513x + 69.962 R² = 0.6164 As you can see, the gold/oil ratio tends to move in cycles. When a downtrend appears to be completed, one can expect a uptrend cycle to ensue.. Of course, it is not guaranteed that changes in trend will happen right away, or that a coming change in the precious metals stocks will be as sharp and impressive as what has just preceded. The influence that is illustrated on the charts above works in the long term range of a particular move and the HUI Index will not necessarily follow the Gold/Oil ratio in the short term. However, should the general tendencies remain in place; we can expect much higher prices of gold and silver stocks in the coming years as long the uptrends outperform the down cycles. $200 $15 $35 $55 $75 Chart 7: Crude Oil and Global - Linear Scale $95 $115 $135 $155 Summing up, no matter how you slice it, gold’s temporary price action relative to oil or lack thereof, is nothing extraordinary. In fact, history shows that there were cases of more dramatic underperformance, followed by more fair valuation, even leading to overvaluation – taking into account the trend equations. Therefore, there is no need to take an immediate action because of extraordinary or – simply put - bad performance of gold relative to crude oil. Moreover, the patterns what we have observed in gold:oil ratio and gold stocks will likely continue outperformances in the gold:oil ratio will likely be followed by periods of underperformance and vice-versa. Sunshine Profits’ proprietary charts, investment tools and market updates are intended to help you spot the right time for an immediate action Chart 8: Gold/Oil Ratio and HUI Index 4 Sunshine Profits 228 Park Avenue South New York, NY 10003 Phone: 1-347-602-4349 Fax: 1-347-602-4560 www.sunshineprofits.com All essays, research and information found on the Website represent the analyses and opinions of Mr. Radomski and Sunshine Profits’ associates only. As such, it may prove wrong and be a subject to change without notice. Opinions and analyses were based on data available to authors of respective essays at the time of writing. Although the information provided on the Website is based on careful research and sources that are believed to be accurate, Mr. Radomski and his associates do not guarantee the accuracy or thoroughness of the data or information reported. The opinions published on the Website belong to Mr. Radomski or respective associates and are neither an offer nor a recommendation to purchase or sell securities. Mr. Radomski is not a Registered Securities Advisor. Mr. Radomski does not recommend services, products, business or investment in any company mentioned in any of his essays or reports. Materials published on the Website have been prepared for your private use and their sole purpose is to educate readers about various investments. By reading Mr. Radomski’s essays or reports you fully agree that he will not be held responsible or liable for any decisions you make regarding any information provided in these essays or reports. Investing, trading and speculation in any financial markets may involve high risk of loss. We strongly advise that you consult a certified investment advisor and we encourage you to do your own research before making any investment decision. Mr. Radomski, Sunshine Profits’ employees and affiliates, as well as members of their families, may have a short or long position in any securities, including those mentioned in any of the reports or essays, and may make additional purchases and/or sales of those securities without notice. 5
