AEM 3100 Intro to MATLAB 11/23/2012 Creating GUIs using
advertisement
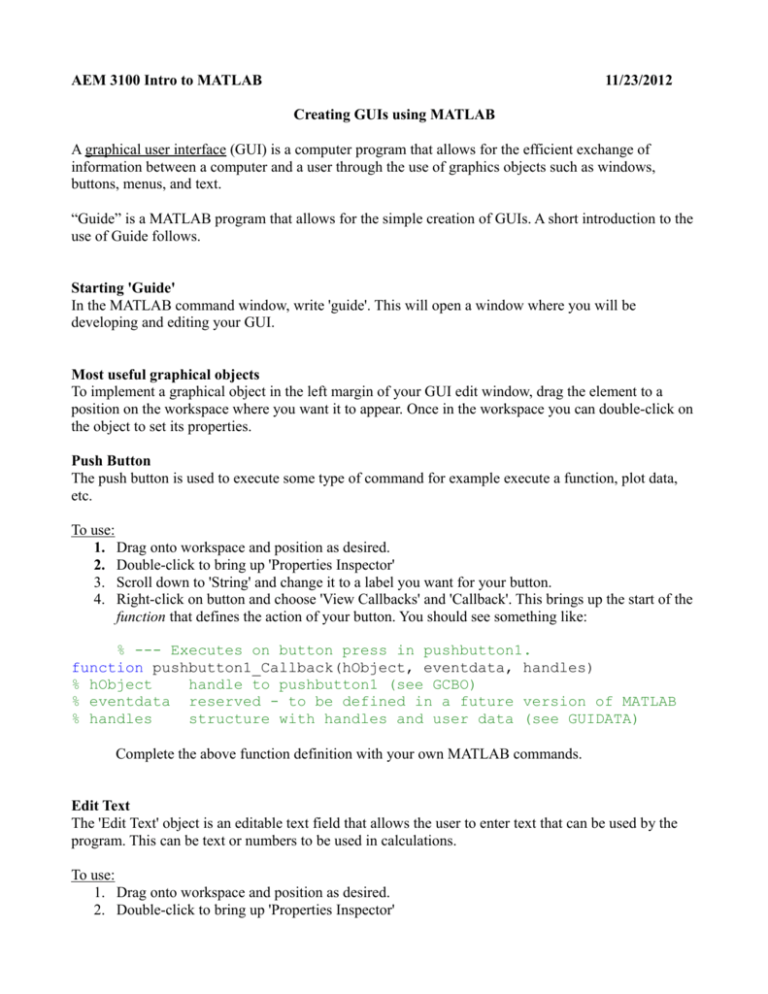
AEM 3100 Intro to MATLAB 11/23/2012 Creating GUIs using MATLAB A graphical user interface (GUI) is a computer program that allows for the efficient exchange of information between a computer and a user through the use of graphics objects such as windows, buttons, menus, and text. “Guide” is a MATLAB program that allows for the simple creation of GUIs. A short introduction to the use of Guide follows. Starting 'Guide' In the MATLAB command window, write 'guide'. This will open a window where you will be developing and editing your GUI. Most useful graphical objects To implement a graphical object in the left margin of your GUI edit window, drag the element to a position on the workspace where you want it to appear. Once in the workspace you can double-click on the object to set its properties. Push Button The push button is used to execute some type of command for example execute a function, plot data, etc. To use: 1. Drag onto workspace and position as desired. 2. Double-click to bring up 'Properties Inspector' 3. Scroll down to 'String' and change it to a label you want for your button. 4. Right-click on button and choose 'View Callbacks' and 'Callback'. This brings up the start of the function that defines the action of your button. You should see something like: % --- Executes on button press in pushbutton1. function pushbutton1_Callback(hObject, eventdata, handles) % hObject handle to pushbutton1 (see GCBO) % eventdata reserved - to be defined in a future version of MATLAB % handles structure with handles and user data (see GUIDATA) Complete the above function definition with your own MATLAB commands. Edit Text The 'Edit Text' object is an editable text field that allows the user to enter text that can be used by the program. This can be text or numbers to be used in calculations. To use: 1. Drag onto workspace and position as desired. 2. Double-click to bring up 'Properties Inspector' 3. Scroll down to 'String' and remove 'Edit Text' so that the field is blank by default. 4. Right-click on button and choose 'View Callbacks' and 'Callback'. This brings up the start of the function that handles the text that you enter into this box function edit1_Callback(hObject, eventdata, handles) % hObject handle to edit1 (see GCBO) % eventdata reserved - to be defined in a future version of MATLAB % handles structure with handles and user data (see GUIDATA) % Hints: get(hObject,'String') returns contents of edit1 as text % str2double(get(hObject,'String')) returns contents of edit1 as a double Complete the above function is appropriate. To enter a numerical value to store and use later, add handles.edit1=str2double(get(hObject,'String'))%change string to %number guidata(hObject, handles); %store the obtained data. % the data can now be accessed as %handles.edit1 To instead change the value of edit1 from within the program, for example to the string 'Text', do set(handles.edit1,'String','Text') Static Text The 'StaticText' object is an non-editable text field that allows the programmer to enter text that can be seen (but not changed) by the user. To use: 1. Drag onto workspace and position as desired. 2. Double-click to bring up 'Properties Inspector' 3. Scroll down to 'String' and replace 'Static Text' by your own text. 4. StaticText has no Callback as it is just text. Axes The axes object provides an area where a plot can be created. To use: 1. Drag onto workspace and position as desired. 2. Resize the axes as desired. 3. The handle (name) of your axes should be visible on the designated area e.g. 'axes1'. This is the name that you will refer to the axes by in order to put a plot there. 4. To plot to these axes: axes(handles.axes1) %go to required axes plot([0:.1:2*pi],v3*sin([0:.1:2*pi])) %any plot command Slider The 'Slider' object is used to change the value of a variable by dragging the slider or clicking on the arrow buttons or channel. To use: 1. Drag onto workspace and position as desired. 2. Double-click to bring up 'Properties Inspector' 3. Scroll down to 'Slider Step' and change the values if necessary: The first number is the step size when the arrow button is clicked. The second number is the step size when the channel is clicked. 4. Scroll down to 'Max' and set the maximum value of the variable. 5. Scroll down to 'Min' and set the minimum value of the variable. 6. Right-click on slider and choose 'View Callbacks' and 'Callback'. This brings up the start of the function that defines the action of the slider. You should see something like: % --- Executes on slider movement. function slider1_Callback(hObject, eventdata, handles) % hObject handle to slider1 (see GCBO) % eventdata reserved - to be defined in a future version of MATLAB % handles structure with handles and user data (see GUIDATA) % Hints: get(hObject,'Value') returns position of slider % get(hObject,'Min') and get(hObject,'Max') to determine range of slider Complete the function for example as follows (see hints above) handles.slider1=get(hObject,'Value'); guidata(hObject, handles); %update handles structure … %a function that uses the slider value is put here
