Cambridge Resources for the IB Diploma
Section 2 Macroeconomics: Answers to Test your
understanding quantitative questions (Chapters 8–12)
Answers have been provided for all quantitative Test your understanding questions throughout the
textbook.
Chapter 8 The level of overall economic activity
Test your understanding 8.6 (page 230)
1
GDP = C + I + G + (X – M)
125 + 35 + 46 + (12 – 17) = 201
GDP = Ftl 201 billion
2
GNI = GDP + income from abroad – income sent abroad
201 + 4.5 – 3.7 = 201.8
GNI = Ftl 201.8 billion
4
(a)
Base year is 2007.
(b)
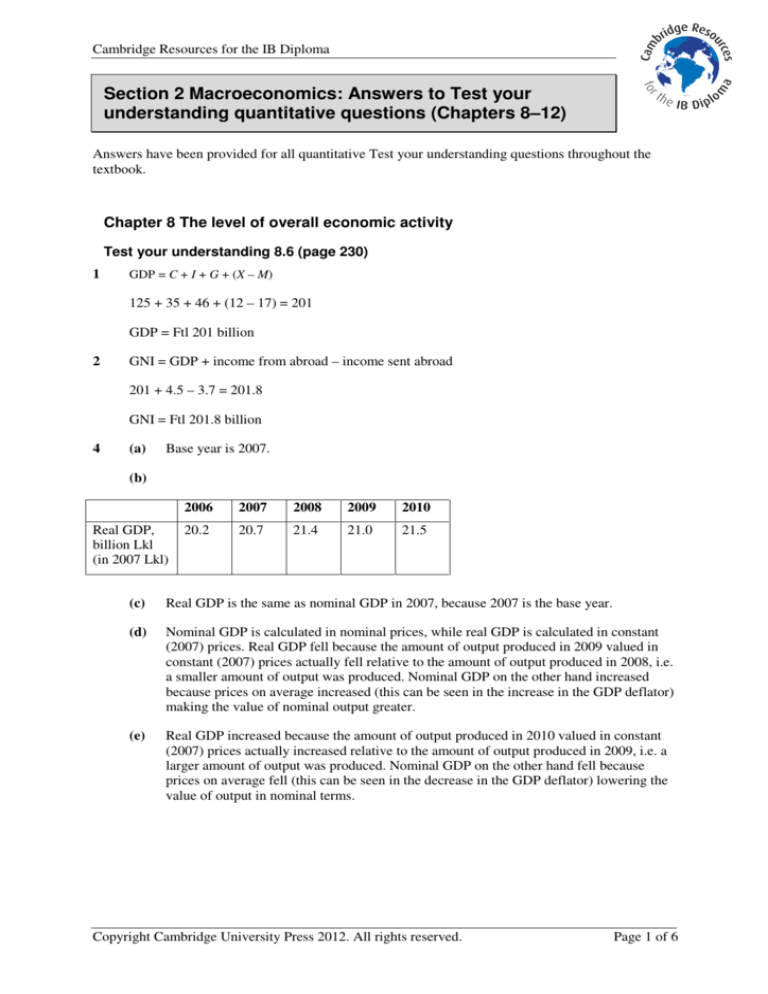
Real GDP,
billion Lkl
(in 2007 Lkl)
2006
2007
2008
2009
2010
20.2
20.7
21.4
21.0
21.5
(c)
Real GDP is the same as nominal GDP in 2007, because 2007 is the base year.
(d)
Nominal GDP is calculated in nominal prices, while real GDP is calculated in constant
(2007) prices. Real GDP fell because the amount of output produced in 2009 valued in
constant (2007) prices actually fell relative to the amount of output produced in 2008, i.e.
a smaller amount of output was produced. Nominal GDP on the other hand increased
because prices on average increased (this can be seen in the increase in the GDP deflator)
making the value of nominal output greater.
(e)
Real GDP increased because the amount of output produced in 2010 valued in constant
(2007) prices actually increased relative to the amount of output produced in 2009, i.e. a
larger amount of output was produced. Nominal GDP on the other hand fell because
prices on average fell (this can be seen in the decrease in the GDP deflator) lowering the
value of output in nominal terms.
Copyright Cambridge University Press 2012. All rights reserved.
Page 1 of 6
Cambridge Resources for the IB Diploma
Chapter 9 Aggregate demand and aggregate supply
Test your understanding 9.8 (page 264)
3
4
multiplier =
1
1− MPC
(a)
MPC = 4 : multiplier =
1
1
=
=5
4
1
1−
5
5
(b)
MPC = 3 : multiplier =
1
1
=
=4
1
1− 3
4
4
(c)
MPC = 2 : multiplier =
1
1
=
=3
1
1− 2
3
3
(d)
MPC = 1 : multiplier =
1
1
=
=2
1
1− 1
2
2
5
4
3
2
The larger the MPC, the larger the multiplier; the smaller the MPC, the smaller the multiplier.
The reason is that if the MPC is large, there are small leakages (withdrawals) from the spending
stream; therefore the consumption spending that feeds back into the spending stream is larger,
making the multiplier larger.
Chapter 10 Macroeconomic objectives I: Low unemployment, low and
stable rate of inflation
Test your understanding 10.1 (page 268)
5
Unemployment rate =
3 .1
× 100 = 11.35%
27.3
Test your understanding 10.4 (page 280)
2
(a)
Real income falls by 3%.
(b)
Real income falls by 13%.
(c)
Real income remains unchanged.
Copyright Cambridge University Press 2012. All rights reserved.
Page 2 of 6
Cambridge Resources for the IB Diploma
Test your understanding 10.6 (page 283)
1
(a)
Real income increases by 8%.
(b)
Real income falls by 8% (–8%).
(c)
Real income increases by 1%.
Test your understanding 10.7 (page 286)
1
(a)
1999
(b)
1999–2000: 5% (= 105 – 100)
1999–2001: 7% (= 107 – 100)
(c)
1998–99:
2000–1:
100 − 95
5
× 100 =
×100 = 5.3%
95
95
107 −105
2
×100 =
×100 = 1.9%
105
105
(d)
1997–98, because the price index falls from 97 to 95.
(e)
The rates of inflation during this time period (calculated above) are:
1998–99:
5.3%
1999–2000:
5.0%
2000–1:
1.9%
Disinflation occurred in 1999–2000 and in 2000–1, because in both cases the rate of
inflation is lower than in the previous year.
3
(a)
Quantity P (£)
in
2008
basket
Value
of
basket
P (£)
Value
of
basket
2009
2008
P (£)
Value
of
basket
2010
2009
P (£)
Value
of
basket
2011
2010
2011
Pizzas
25
7
175
6
150
7
175
6
150
DVDs
9
15
135
17
153
18
162
18
162
47
2
94
4
188
4
188
3
141
Bus
rides
Total
value
404
491
Copyright Cambridge University Press 2012. All rights reserved.
525
453
Page 3 of 6
Cambridge Resources for the IB Diploma
Price index:
404
×100 = 82.3
491
2008:
2009: 100 (since this is the base year)
2010:
525
×100 = 106.9
491
2011:
453
×100 = 92.3
491
(b)
The weights here are the quantity (number of units) of each good in the basket, appearing
in the first column of the table.
(c)
2008–9:
100 − 82.3
× 100 = 21.5%
82.3
2009–10: 6.9% (we can ‘read’ this off directly from the price index)
2010–11:
(d)
92.3 −106.9
× 100 = –13.7%
106.9
Inflation occurred in 2008–9 and 2009–10, because there was an increase in the average
price level.
Deflation occurred in 2010-11, because there was a decrease in the average price level.
Disinflation occurred in 2009–10 because the rate of inflation (6.9%) was lower than in
the previous year (21.5%).
(e)
Use the same method as in part (a) (and in the textbook, pages 283–4) to calculate the
price index:
2008
76.9
2009
93.5
2010
100
2011
86.3
(f)
You should find that the rates of inflation/deflation are the same as those you have
calculated in part (c) above (any small difference is due to rounding).
(g)
See part (f) above.
(h)
No, it would not make sense. Each price index is calculated relative to a particular base
year, and the index numbers make sense only in relation to that base year. (You can see
this by comparing the index numbers of the two price indices you calculated above.)
Copyright Cambridge University Press 2012. All rights reserved.
Page 4 of 6
Cambridge Resources for the IB Diploma
Chapter 11 Macroeconomic objectives II: Economic growth and
equity in the distribution of income
Test your understanding 11.1 (page 295)
4
(a)
2007–8:
1611−1579
×100 = 2.03%
1579
(b)
2008–9:
1597 −1611
×100 = –0.87%
1611
(c)
In 2008–9.
5
This can happen if the population is growing more rapidly (a higher rate of growth) than
nominal GDP.
6
2.2% – 1.5% = 0.7% growth in real GDP per capita.
Test your understanding 11.8 (pages 316–17)
1
(a)
Zero income tax.
(b)
Income between $10 001 and $25 000 is taxed at 9%.
$15 700 – $10 000 = $5700
$5700 × 0.09 = $513 is the amount of income tax paid.
(c)
Income between $10 001 and $25 000 is taxed at 9%; therefore tax paid is $15 000 × 0.09
= $1350
Income above $25 000 and less than $55 000 is taxed at 22%:
$31 000 – $25 000 = $6000
$6000 × 0.22 = $1320
Therefore total income tax is $1350 + $1320 = $2670
(d)
For income between $10 001 and $25 000, income tax is $1350 (see part (c)).
Income above $25 001 and less $55 000 is taxed at 22%:
$47 000 – $25 000 = $22 000
$22 000 × 0.22 = $4840
Therefore total income tax is $1350 + $4840 = $6190
Copyright Cambridge University Press 2012. All rights reserved.
Page 5 of 6
Cambridge Resources for the IB Diploma
(e)
For income between $10 001 and $25 000, income tax is $1350.
For income between $25 001 and $55 000, income tax is $30 000 × 0.22 = $6600
For income between $55 001 and $115 000, income tax is $60 000 × 0.40 = $24 000
For income above $115:
$120 000 – $115 000 = $5000
$5000 × 0.55 = $2750
Therefore total income tax is $1350 + $6600 + $24 000 + $2750 = $34 700
2
3
4
(a)
Average income tax rates:
$6500:
0
$15 700:
$513
× 100 = 3.3%
$15 700
$31 000:
$2670
× 100 = 8.6%
$31 000
$47 000:
$6190
× 100 = 13.2%
$47000
$120 000:
$34 700
× 100 = 28.9%
$120 000
(b)
The average tax rate increases as income increases because this is a progressive tax
system.
(c)
Marginal tax rates:
$6500:
0
$15 700:
9%
$31 000:
22%
$47 000:
22%
$120 000:
55%
(a)
$25 000 × 0.20 = $5000
(b)
$5000
× 100 = 16.1%
$31 000
8.6% + 16.1% = 24.7%
Copyright Cambridge University Press 2012. All rights reserved.
Page 6 of 6


