Summary Income Statement Report Help
advertisement

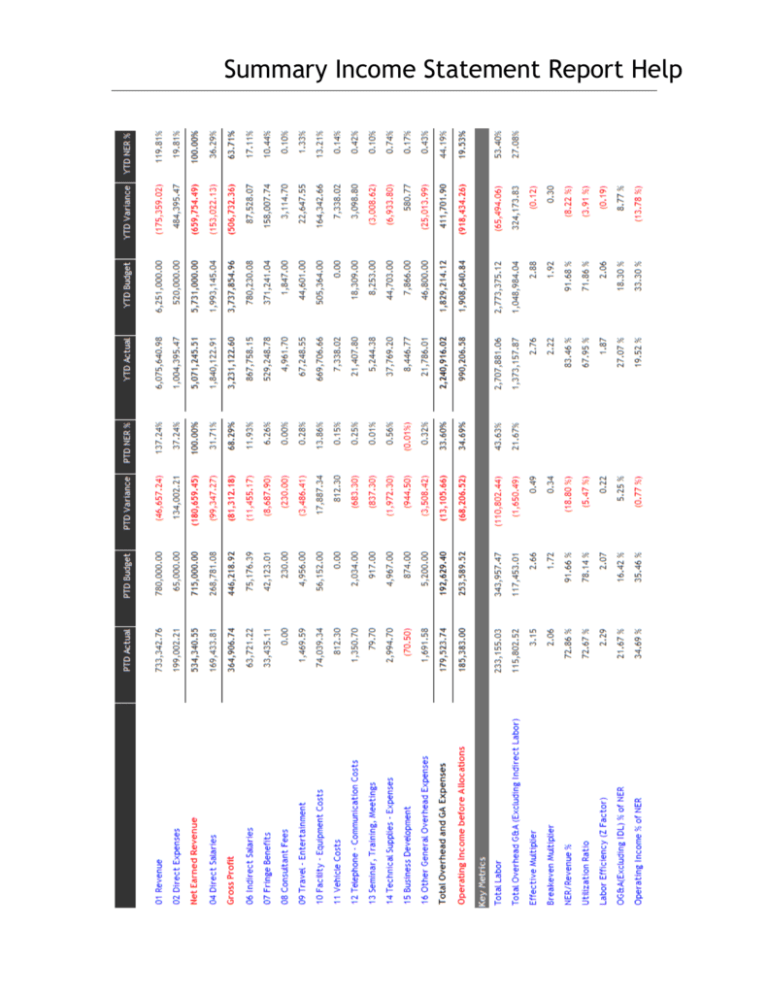
Summary Income Statement Report Help Summary Income Statement Report Help Report Key: Click blue text and underlined numbers to drill down or link to a related report. Positive numbers are black; negative numbers are red in parenthesis. Example: Linked Detail Reports Click on any blue account group name to see individual account amounts on the Detailed Income Statement. Click any blue metric name to see individual group amounts for that metric. Report Columns Column Head Business Rule Implementation PTD Actual Period to date actual amounts (PTD GL Balance Debit –PTD GL Balance Credit) * -1 PTD Budget Period to date budget amounts (PTD GL Budget Debit –PTD GL Budget Credit) * -1 PTD Variance Difference between Actual amounts and Budgeted amounts for the reporting period PTD Actual – PTD Budget PTD NER% Ratio of Actual to Net Earned Revenue for the reporting month PTD Actual/Net Earned Revenue * 100 YTD Actual Year to date actual Amounts (YTD GL Balance Debit –YTD GL Balance Credit) * -1 YTD Budget Year to date budget amounts (YTD GL Budget Debit –YTD GL Budget Credit) * -1 YTD Variance Difference between Actual amounts and Budgeted amounts for year containing the reporting period YTD Actual – YTD Budget YTD NER % Ratio of Actual to Net Earned Revenue for year containing the reporting period YTD Actual/Net Earned Revenue * 100 Rows – Key Metrics Key Metric Name Business Rule Implementation Total Labor Direct Labor plus Indirect Labor. Cost of all labor assigned to projects and to overhead. direct labor + indirect labor Total Overhead G&A ( Excluding Indirect Labor) General & administrative overhead less indirect labor total overhead – indirect labor Effective Multiplier (Earned Revenue less all reimbursable expenses) divided by total direct labor. Net Earned Revenue / direct labor Break Even Multiplier (Total Budgeted OH plus Total Budgeted Direct Labor) divided by Total Budgeted Direct Labor. Also expressed as overhead rate plus 1.00 for direct labor. (total overhead + direct labor )/ direct labor NER/Revenue % Net Earned Revenue divided by Revenue expressed as a percentage (Revenue – Direct Expenses)/Total Revenue * 100 Utilization Ratio Ratio of direct labor to total labor direct salaries / (Indirect salaries+ direct salaries) Summary Income Statement Report Help Key Metric Name Business Rule Implementation Labor Efficiency (Z Factor) Net Earned Revenue divided by labor cost (Revenue-Direct Expenses)/(total labor) OG&A(Excluding IDL) % of Ratio of (overhead other than labor) to NER total overhead – indirect labor / NER Operating Income % of NER Ratio of operating income to NER operating income (before allocations) / NER Direct Labor Hours Hours charged to a billable project where Expense Type = Regular Time or OT Premium and Expense Category = Labor Imported from Time Sheets during RevGen Indirect Labor Sum(Amounts) posted to Accounting Group ‘06 Indirect Salaries’ Includes charges to GOH Technical, PTO, Sick, Holiday and Other Labor Multiplier Labor Revenue divided by Labor Expense total revenue labor / total Expenses Labor Revenue Per Hour Direct Labor Revenue divided by Direct Labor Hours Account 4000 Revenue – Labor Actual / Direct Labor Hours Headcount Number of employees assigned to the project as of the report period Project assignment start date is before or within the fiscal year and project assignment end date is after the start of the fiscal year or report period Project Backlog The amount of budgeted revenue not yet earned Revenue Budget –Revenue Actual Ner Per Employee Net Earned Revenue divided Headcount (Revenue –Direct Expenses) / Headcount NER


