Measuring Labor Shortages and Surpluses
advertisement
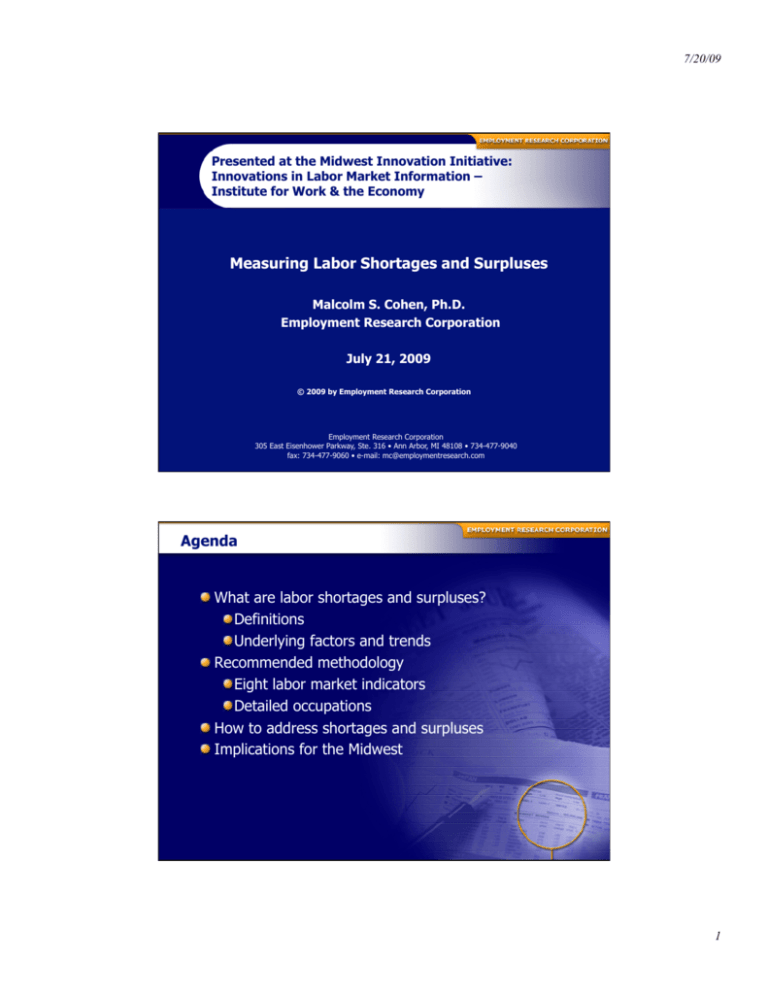
7/20/09 Presented at the Midwest Innovation Initiative: Innovations in Labor Market Information – Institute for Work & the Economy Measuring Labor Shortages and Surpluses Malcolm S. Cohen, Ph.D. Employment Research Corporation July 21, 2009 © 2009 by Employment Research Corporation Employment Research Corporation 305 East Eisenhower Parkway, Ste. 316 • Ann Arbor, MI 48108 • 734-477-9040 fax: 734-477-9060 • e-mail: mc@employmentresearch.com Agenda What are labor shortages and surpluses? Definitions Underlying factors and trends Recommended methodology Eight labor market indicators Detailed occupations How to address shortages and surpluses Implications for the Midwest 1 7/20/09 Definitions What is a labor shortage? No universal definition . . . Static Shortage: condition in which employer demand for workers is greater than supply of workers willing to work at that wage rate Blank-Stigler define dynamic shortage as when supply of workers increases less rapidly than number demanded Arrow-Capron define dynamic shortage as when there is a steady upward shift in the demand curve, resulting in unfilled vacancies Definitions (cont) Situation where D > S at prevailing wage for a sustained period Implies ‘excess’ vacancies, but how many? Duration of disequilibrium required to consider it a shortage “Skills shortage” v. “occupational shortage” Many dimensions of a shortage: Geographic scope Longevity Severity Sub-specialty shortage 2 7/20/09 Underlying Factors Why might labor shortages occur? Increase in demand for labor Restrictions on prices Movement to a higher paying occupation Time lags and slow adjustment Demographic trends and retirement age Education and productivity Immigration policy Time Frame Last year Today Short term (1-2 years) Intermediate term (2-5 years) Long term (5-15 years) Seasonal considerations Gardeners in the winter Retail workers in December 3 7/20/09 Underlying Factors Why might labor surpluses occur? Low vacancies High unemployment Supply greater than demand Demand falling Underlying Factors Impact of new technologies and work organization Growth of internet and decline of newspapers Physician assistants Frozen and fast foods Renewable energy, “smart grids”, and green building Hybrid vehicles and battery technologies 4 7/20/09 Underlying Factors Policy and Business Cycle Assumptions Will Current Stimulus Be Enough? ‘Green jobs’ Investment in new infrastructure, highways and rail When Will Current Recession End? What will happen to the Global Economy? What Will Immigration Policy Be? Outsourcing Government / Company Spending on Medical Care Digitizing recordkeeping Underlying Factors Geographic variation and dependency Urban versus rural (e.g. Doctors in Chicago) Universities and leading labs (e.g. 400 applicants at Harvard) High cost of living areas Auto industry impact on the Midwest 5 7/20/09 Labor Force Trends US Labor Force Participation – 55 yrs and over Source: Bureau of Labor Statistics, Current Population Survey Measuring Shortages Job vacancy surveys Look for increase in number and duration of vacancies Employer skill surveys Used to determine what requirements businesses foresee for different types of labor Using help-wanted advertising Labor demand and supply matrices Labor market indicators 6 7/20/09 Methodology Labor Market Indicators 1 Past Employment Change 2 Past Unemployment Rate 3 Past Wage Change 4 Training Required 5 Replacement Demand 6 Forecasted Demand 7 Immigrants Certified 8 Vacancy Rates Labor Market Indicators US 2005-2008 Indicator Architecture/ Electrical & All Engineering Electronics Occupations Occupations Engineers Special Grounds Physical Education Maintenance Therapists Teachers Workers Past Employment Change Annual % Change 2005-2008 0.8% 1.6% -0.2% -2.8% 3.6% 2.1% 2.1% 1.6% 1.3% 0.8% 10.5% 4.0% 2.3% 2.8% 4.3% 2.6% Past Unemployment Rate Average 2006 -2008 4.6% rate Past Wage Change Annual % Change 3.5% 2005-2008 Computed from BLS Current Population Survey Source Data 7 7/20/09 Labor Market Indicators US 2nd Quarter 2008 to 2nd Quarter 2009 Indicator Architecture/ All Engineering Occupations Occupations Electrical & Special Grounds Physical Electronics Education Maintenance Therapists Engineers Teachers Workers Past Employment Change Annual % Change Q2.2008Q2.2009 -3.8% -4.7% -7.0% 4.6% -26.0% -5.3% 4.9% 5.8% 1.3% 0.7% 10.8% Past Unemployment Rate Average Q2.2008Q2.2009 rate 6.6% Computed from BLS Current Population Survey Source Data Unemployment Rates by State Source: U.S. Bureau of Labor Statistics 8 7/20/09 Percentage Change in Nonfarm Source: U.S. Bureau of Labor Statistics Employment in Midwest Fastest Growing Occupations /Midwest Occupation Title Total Employment 2008 % Employment Change 2005-2008 Compliance officers, except agriculture, construction, health and safety, and transportation 43,940 39.89% Home health aides 215,870 39.06% 58,090 37.69% 79,890 31.57% 49,030 31.45% 31,077,450 1.16% Physicians and surgeons, all other Network and computer systems administrators Network systems and data communications analysts All Occupations Computed from BLS Occupational Employment Statistics Data 9 7/20/09 Employment in Midwest Fastest Declining Occupations/Midwest Total Employment 2008 % Employment Change 2005-2008 31,077,450 1.16% Chefs and head cooks 18,770 -27.36% Computer operators 22,060 -24.74% Cooks, short order 42,760 -24.12% Cooks, fast food 124,210 -24.04% Switchboard operators, including answering service 31,920 -23.67% Occupation Title All Occupations Computed from BLS Occupational Employment Statistics Data Job Vacancies – Minnesota 2008 2nd Quarter All Occupations JV JVR 51,722 Architecture and Engineering Training Required Occupations Replacement Demand Electrical Engineer Replacement Demand (%) Forecasted Demand %Change in Employment Immigrants Certified Foreign Labor Certification Data Center 2008 %Denied TOTEMPLOY (thousands) Certifications per thousand employed Landscaping and Groundskeeping Workers Bachelor's 1,170degree Architecture and TOTAL 33.68% 10.40% 139engineering JV JVR 1.9% 31,066 1.2% 2.3% degree Bachelor's Bachelor's or higher degree, plus work experience 4.3% 932 81 Master's degree Grounds 2.5% maintenance 1,15210.40% 5.00% 8.2% 15.50% 208 27.10% 15.75% 2931 0.263 17.01% 350 0.823 14.46% 387 0.171 40.00% 197 0.010 17.31% 235 0.6% 8.0% 38 114 Short-term & moderateterm, on the 1.8% job training Electrical and Special education Physical occupations electronics engineers teachers therapists 32.98% 28.18% 37.69% 39.31% Special Education Teachers - 145,362 0.338 Preschool, Kindergarten, and 33 Elementary School Physical Therapists 4th Quarter workers 31.01% 17.80% 1.5% 51.52% 1262 0.047 0.7% 3.9% Source: MN Department of Employment and Economic Development, Labor Market Information Office, Minnesota Job Vacancy Survey Compiled by: Rachel Vilsack, Regional Labor Market Analyst Date: May 15, 2009 10 7/20/09 Limitations of Indicators Sampling error Non-sampling error Universe measured Conceptually best measure Starting wages rather than average wages Hard to fill vacancies Establishment surveys may provide more accurate measures How to address shortages in Midwest Supply-driven strategy Develop inventory of Midwest employee skills Identify industries that utilize these skills Develop a program to attract employers in these industries to the Midwest 11 7/20/09 How to address shortages in Midwest Demand-driven strategy Identify fastest growing occupations Offer training funds for workers to retrain in these occupations How to address shortages in Midwest Policy and funds strategy Project budgets of government agencies Project research and development funding by corporations Analyze occupations needed for projected funding Offer training funds for workers to retrain in these occupations 12 7/20/09 Policy and fund strategy Examples Digitizing medical records ‘Green stimulus’ Obama’s health care plan Implications of LMI Research for Midwest Labor market indicators Assist in analyzing current and future labor shortages and surpluses Can be customized for the Midwest and individual states Helpful in designing and optimizing training dollars in the Midwest Useful in labor market analysis Used in conjunction with additional labor market data to understand workforce needs in the Midwest 13 7/20/09 How to Contact Us Employment Research Corporation 305 East Eisenhower Parkway, Suite 316 Ann Arbor, MI 48108 Phone: 734-477-9040 Fax: 734-477-9060 mc@employmentresearch.com www.employmentresearch.com 14

