Quadratic Functions
advertisement
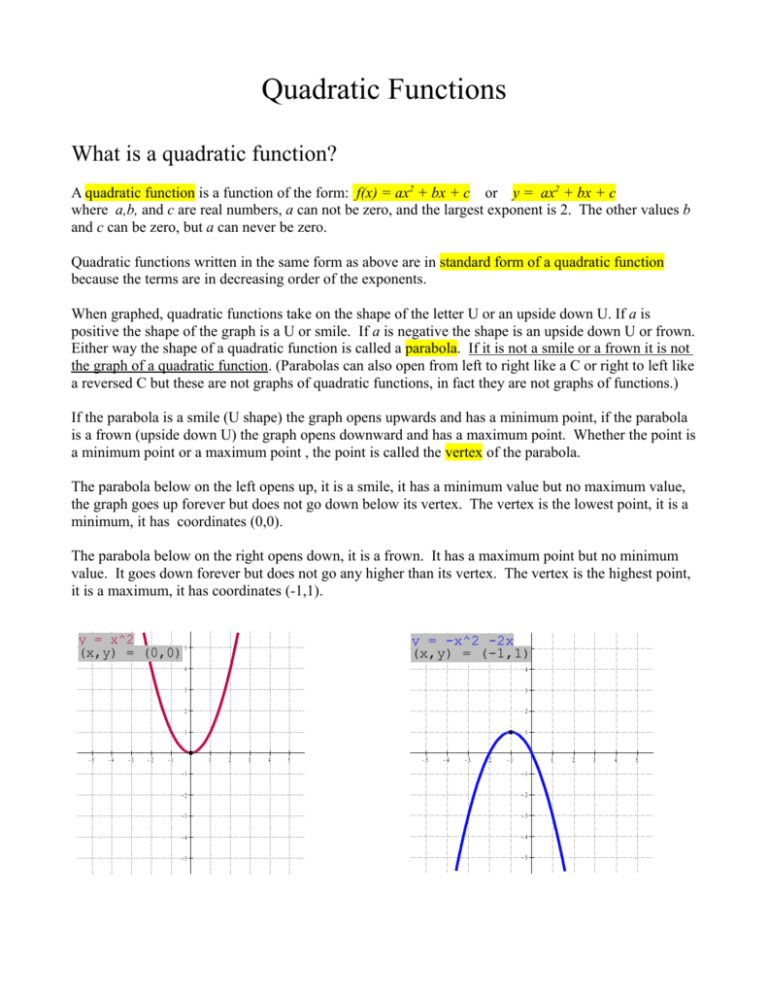
Quadratic Functions What is a quadratic function? A quadratic function is a function of the form: f(x) = ax2 + bx + c or y = ax2 + bx + c where a,b, and c are real numbers, a can not be zero, and the largest exponent is 2. The other values b and c can be zero, but a can never be zero. Quadratic functions written in the same form as above are in standard form of a quadratic function because the terms are in decreasing order of the exponents. When graphed, quadratic functions take on the shape of the letter U or an upside down U. If a is positive the shape of the graph is a U or smile. If a is negative the shape is an upside down U or frown. Either way the shape of a quadratic function is called a parabola. If it is not a smile or a frown it is not the graph of a quadratic function. (Parabolas can also open from left to right like a C or right to left like a reversed C but these are not graphs of quadratic functions, in fact they are not graphs of functions.) If the parabola is a smile (U shape) the graph opens upwards and has a minimum point, if the parabola is a frown (upside down U) the graph opens downward and has a maximum point. Whether the point is a minimum point or a maximum point , the point is called the vertex of the parabola. The parabola below on the left opens up, it is a smile, it has a minimum value but no maximum value, the graph goes up forever but does not go down below its vertex. The vertex is the lowest point, it is a minimum, it has coordinates (0,0). The parabola below on the right opens down, it is a frown. It has a maximum point but no minimum value. It goes down forever but does not go any higher than its vertex. The vertex is the highest point, it is a maximum, it has coordinates (-1,1). y = x^2 (x,y) = (0,0) 5 −5 −4 −3 −2 y = -x^2 -2x 5 (x,y) = (-1,1) 4 4 3 3 2 2 1 1 −1 1 2 3 4 5 −5 −4 −3 −2 −1 1 −1 −1 −2 −2 −3 −3 −4 −4 −5 −5 2 3 4 5 Quadratic Functions How do you graph quadratic functions? Start by finding the coordinates of the vertex. To find the coordinates of the vertex put the quadratic function in standard form and then get the values of a, b, and c. If there is no bx term the value of b is zero. If there is no c term the value of c is 0. To find the x-coordinate of the vertex use the formula Vx = -b/(2a). To find the y-coordinate of the vertex use the formula Vy = c – b2/(4a). Every graph of a quadratic function has a vertical line that passes right through the middle of it cutting it in half from top to bottom. This line passes through the vertex. The line is like a mirror. One side of the graph looks exactly like the other. This line is a line of symmetry and is called the axis of symmetry. Once you know the x-coordinate of the vertex you automatically know the equation of the axis of symmetry, just write the equation x = Vx . For instance if Vx is 5 then the equation of the axis of symmetry is x = 5. You can use the axis of symmetry to help graph the quadratic function. Each point on the graph has a matching point on the other side of the axis of symmetry. Both points are on opposite sides of the axis of symmetry but are the same horizontal distance from the axis of symmetry. Plot the vertex and then draw the axis of symmetry. Now pick an x-value on one side of the axis of symmetry and calculate the y-value using the quadratic function. Plot the point. The matching point will be the same horizontal distance away as the first point but on the other side of the axis of symmetry. Test that point to make sure it is correct by putting its x-value into the quadratic function. The y-value that you get should be the same as the y-value of the first point. Using an input-output table and selecting four other points besides the vertex is a good way to get points to graph a quadratic function. The axis of symmetry is always a vertical line that passes through the vertex cutting the graph in half from top to bottom. You can see this in the graphs below. Also notice that no matter what point you pick - except for the vertex - there is always a point on the other side of the graph that is at the same height (same y-value) and the same horizontal distance from the axis of symmetry. y = -x^2 -2x x = -1 −5 −4 −3 −2 y = x^2 - 2x 5 x = 1 (x,y) = (1,-1)4 5 4 3 3 2 2 1 1 −1 1 2 3 4 5 −5 −4 −3 −2 −1 1 −1 −1 −2 −2 −3 −3 −4 −4 −5 −5 2 3 4 5 Quadratic Functions Key points about quadratic functions: All quadratic functions are of the form f(x) = ax2 + bx + c or y = ax2 + bx + c (a,b, and c are real numbers). All quadratic functions open up if a > 0, if a is positive the graph is a happy graph and the graph is a smile :) All quadratic functions open down if a < 0, if a is negative the graph is a sad graph and the graph is a frown :( The absolute value of a (ignoring its sign) determines how wide the graph is. The smaller |a| is, the wider the graph is. The larger |a| is, the narrower the graph is. No matter what the values of a, b, and c are, when x = 0, y = ax2 + bx + c evaluates to c so c is the y-intercept of all quadratic functions. The x-coordinate of the vertex is calculated using the formula Vx = -b/(2a). The y-coordinate of the vertex is calculated using the formula Vy = c – b2/(4a). The equation of the axis of symmetry is found by setting x equal to the x-coordinate of the vertex (x = Vx). The axis of symmetry is always a vertical line cutting the parabola right down the middle from top to bottom and it always passes through the vertex. When b = 0 (there is no bx term) the axis of symmetry is the y-axis and Vx = 0. For non-zero values of b it is not as easy to know where the axis of symmetry is. You need to use the formula for Vx in this situation.
