Graphing Quadratic Functions Worksheet
advertisement
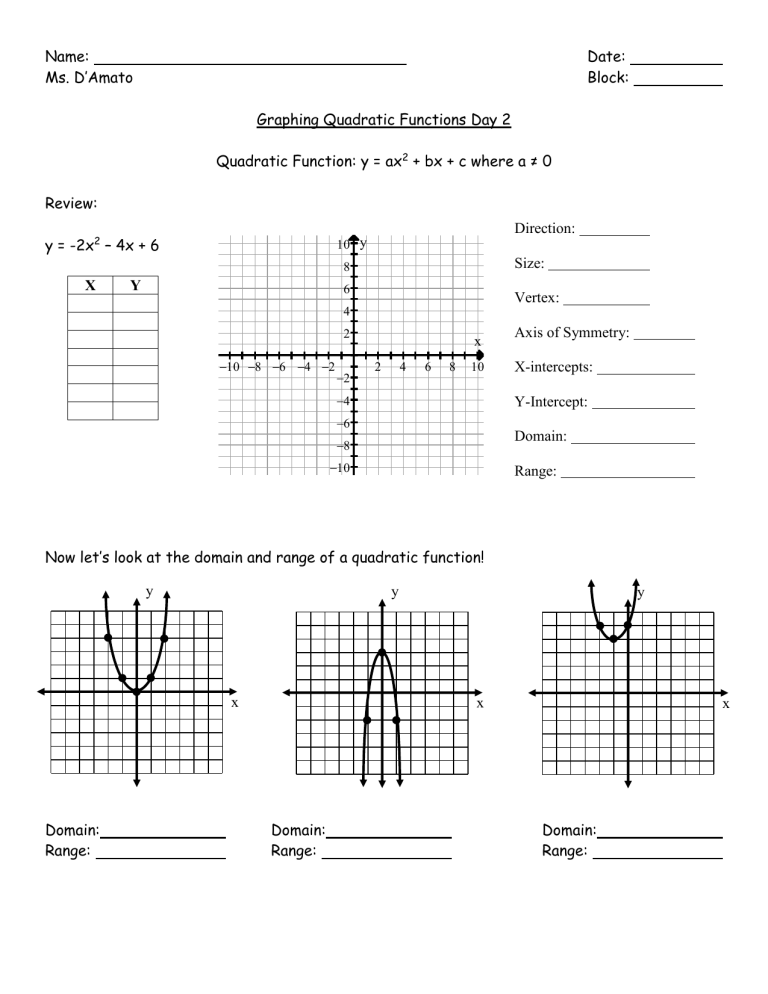
Name: Ms. D’Amato Date: Block: Graphing Quadratic Functions Day 2 Quadratic Function: y = ax2 + bx + c where a ≠ 0 Review: y = -2x2 – 4x + 6 Direction: y Size: X Y Vertex: x Axis of Symmetry: X-intercepts: Y-Intercept: Domain: Range: Now let’s look at the domain and range of a quadratic function! y y x Domain: Range: y x Domain: Range: x Domain: Range: y y y x Domain: Range: x x Domain: Range: Domain: Range: Ms. D’Amato: Let’s graph some more quadratic functions. Students: Ms. D. that’s so much work! Ms. D’Amato: Well, then let me show you how to graph quadratic functions on your calculator!! Steps to Graph Quadratics on the Calculator Step 1: Hit the y = button and enter in the quadratic equation. Step 2: Hit the graph button. To see the table of values, hit the 2nd button and then graph. Step 3: Find the vertex of the quadratic function on your table of values and find points to the left and right of the vertex to use in your table (remember the symmetry of a quadratic function) 1. y = -x2 – 6x – 8 Direction: y X Y Size: Vertex: x Axis of Symmetry: X-intercepts: Y-Intercept: Domain: Range: Verify the vertex by using the vertex formula: 2. f(x) = x2 – 7x + 10 y Direction: X Y Size: Vertex: x Axis of Symmetry: X-intercepts: Y-Intercept: Domain: Range: Verify the vertex by using the vertex formula:
