MENA M&A Quarterly Bulletin
advertisement
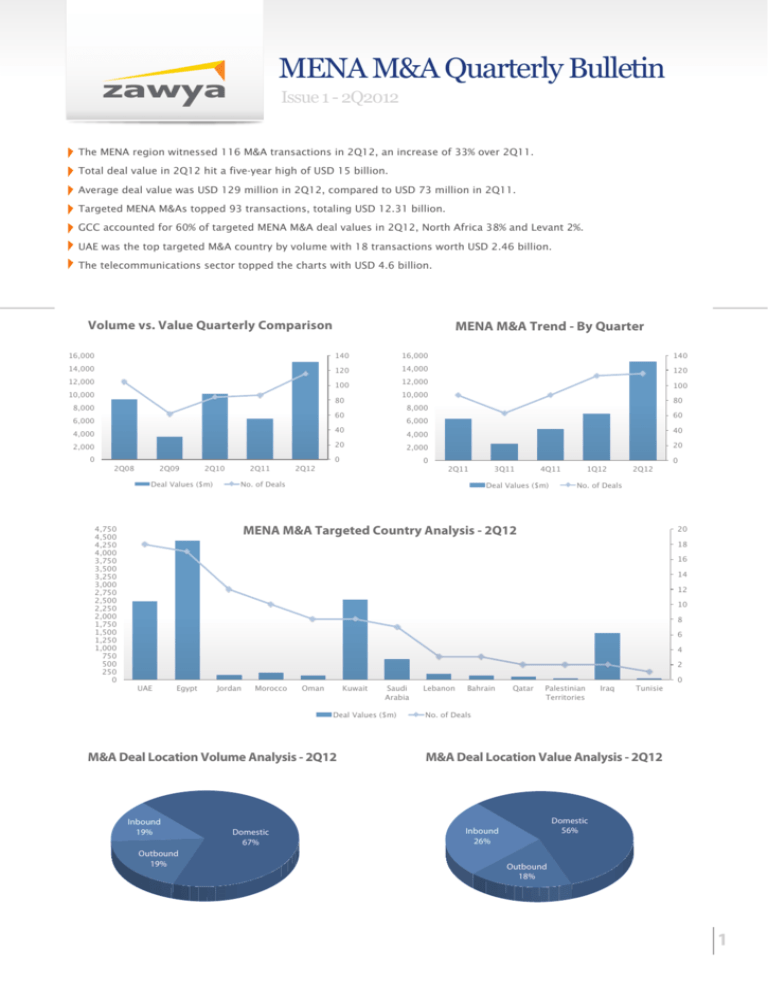
MENA M&A Quarterly Bulletin Issue 1 - 2Q2012 The MENA region witnessed 116 M&A transactions in 2Q12, an increase of 33% over 2Q11. Total deal value in 2Q12 hit a five-year high of USD 15 billion. Average deal value was USD 129 million in 2Q12, compared to USD 73 million in 2Q11. Targeted MENA M&As topped 93 transactions, totaling USD 12.31 billion. GCC accounted for 60% of targeted MENA M&A deal values in 2Q12, North Africa 38% and Levant 2%. UAE was the top targeted M&A country by volume with 18 transactions worth USD 2.46 billion. The telecommunications sector topped the charts with USD 4.6 billion. Volume vs. Value Quarterly Comparison 14,000! 14,000! 120! 12,000! 2Q08! 2Q09! 2Q10! Deal Values ($m)! 4,750! 4,500! 4,250! 4,000! 3,750! 3,500! 3,250! 3,000! 2,750! 2,500! 2,250! 2,000! 1,750! 1,500! 1,250! 1,000! 750! 500! 250! 0! 2Q11! 2Q12! 40! 4,000! 20! 2,000! 60! 6,000! 40! 4,000! 80! 8,000! 60! 6,000! 100! 10,000! 80! 8,000! 120! 12,000! 100! 10,000! 140! 16,000! 140! 16,000! 0! MENA M&A Trend - By Quarter 20! 2,000! 0! 0! 2Q11! No. of Deals! 3Q11! 4Q11! Deal Values ($m)! 1Q12! 2Q12! 0! No. of Deals! MENA M&A Targeted Country Analysis - 2Q12 20! 18! 16! 14! 12! 10! 8! 6! 4! 2! UAE! Egypt! Jordan! Morocco! Oman! Kuwait! Saudi Arabia! Deal Values ($m)! M&A Deal Location Volume Analysis - 2Q12 Inbound 19% Outbound 19% Domestic 67% Lebanon! Bahrain! Qatar! Palestinian Territories! Iraq! Tunisie! 0! No. of Deals! M&A Deal Location Value Analysis - 2Q12 Domestic 56% Inbound 26% Outbound 18% 1 MENA M&A Quarterly Bulletin Issue 1 - 2Q 2012 MENA M&A Volume Sector Analysis - 2Q12 Other! Power and Utilities! Leisure and Tourism! Services! Oil and Gas! Consumer Goods! Health Care! Retail! Media! Telecommunications! Transport! Industrial Manufacturing! Food and Beverages! Construction! Real Estate! Financial Services! No. of Deals! 0! 5! 10! 15! 20! 25! MENA M&A Value Sector Analysis - 2Q12 Other! Health Care! Industrial Manufacturing! Food and Beverages! Power and Utilities! Real Estate! Leisure and Tourism! Value in $m! Construction! Consumer Goods! Oil and Gas! Transport! Financial Services! Telecommunications! 0! 500! 1,000! 1,500! 2,000! 2,500! 3,000! 3,500! 4,000! 4,500! 5,000! MENA M&A Deal Value Ranges Deal Values - 2Q12 No. of Deals < USD 50 million USD 50 million - USD 100 million >USD 100 million Undisclosed Deal Values YoY Total Deal Values (in $m) 41 3 21 51 382 178 14,445 Top 5 Valued M&A Transactions in 2Q12 Acquirer Name Country Sector MT Telecom SCRL France Mubadala Development Company UAE National Bank of Kuwait Qatar Telecom The National Shipping Company of Saudi Arabia Kuwait Qatar Saudi Arabia YoY Target Name Country Sector Telecommunications Egyptian Company for Mobile Services Financial Services EMI Music Publishing Egypt Telecommunications United States Financial Services Financial Services Boubyan Bank Telecommunications AsiaCell for Communication Transport Vela International Marine Kuwait Iraq UAE Financial Services Telecommunications Transport Deal Value % Bought ($m) 94% 3,135 - 2,200 53% 30% 100% 2,070 1,470 1,300 Important Notes: 1- Data included in the M&A Quarterly bulletin reflects deals that are Confirmed, In Process and Complete. 2- MENA includes Bahrain, Egypt, Iraq, Jordan, Kuwait, Lebanon, Morocco, Oman, Palestine Territories, Qatar, Saudi Arabia, Syria, Tunisia and UAE. 3- Data is correct as of June 2012, Source: M&A Monitor, www.zawya.com/middle-east/mergers-acquisitions/ Prepared by Michel El Maalouly, michel@zawya.com For further information, contact us at manda@zawya.com Copyright Zawya 2012 2
