Kinetic & Affinity Analysis
advertisement
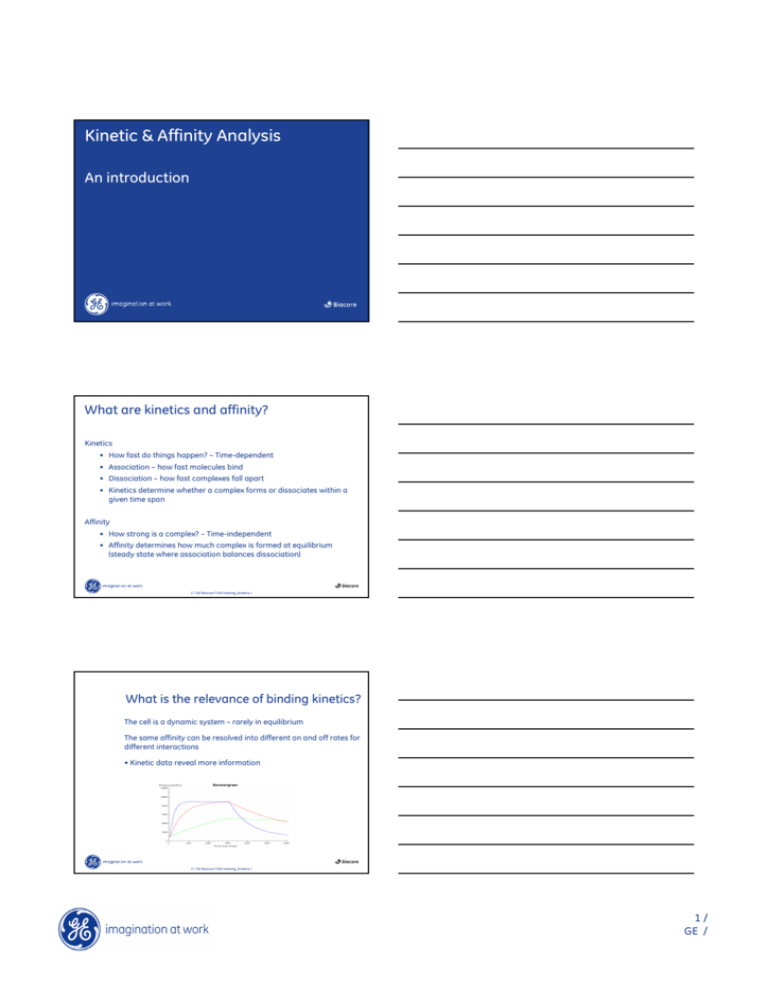
Kinetic & Affinity Analysis An introduction What are kinetics and affinity? Kinetics • How fast do things happen? – Time-dependent • Association – how fast molecules bind • Dissociation – how fast complexes fall apart • Kinetics determine whether a complex forms or dissociates within a given time span Affinity • How strong is a complex? – Time-independent • Affinity determines how much complex is formed at equilibrium (steady state where association balances dissociation) 2 / GE Biacore T100 training_kinetics / What is the relevance of binding kinetics? The cell is a dynamic system – rarely in equilibrium The same affinity can be resolved into different on and off rates for different interactions • Kinetic data reveal more information 3 / GE Biacore T100 training_kinetics / 1/ GE / Same affinity but different kinetics All 4 compounds have the same affinity KD = 10 nM = 10-8 M The binding kinetic constants vary by 4 orders of magnitude Concentration = 1000 nM Concentration = 100 nM kon koff 106 10-2 105 10-3 104 10-4 103 10-5 (M-1s-1) (s-1) Response All target sites occupied 30 min 30 min 60 min 60 min Time Time 4 / GE Biacore T100 training_kinetics / Three ways to obtain kinetic and affinity data in Biacore Monitor association and dissociation rates • Affinity Kinetics Monitor steady state levels • Affinity Kinetics Measure free analyte in solution • Affinity Kinetics 5 / GE Biacore T100 training_kinetics / Rate equations for 1:1 kinetics A Association: Dissociation: d [AB] dt -d [AB] dt ka kd B AB B A ka [A] [B] kd [AB] ka [A] [B] kd [AB] M-1s-1 M M s-1 M B A Net rate equation: d [AB] dt M/s where k a association rate constant [M-1s-1] k d dissociation rate constant [s-1] 6 / GE Biacore T100 training_kinetics / 2/ GE / Equilibrium constants At equilibrium: Dissociation Association ka [A] [B] kd [AB] M-1s-1 M M s-1 M The equilibrium constants: KA ka kd [AB] [A] [B] the equilibrium association constant [M-1] KD kd ka [A] [B] [AB] the equilibrium dissociation constant [M] 7 / GE Biacore T100 training_kinetics / Equilibrium and kinetics in Biacore ka A + B ⇔ AB kd A is the analyte in solution • Free concentration maintained constant by flow system AB is the complex • Concentration of complex measured directly as R in RU B is the ligand on the surface • Total concentration can be expressed in RU, as maximum binding capacity Rmax • Free concentration is Rmax-R We do not need to know the “real” concentration of ligand or complex 8 / GE Biacore T100 training_kinetics / Rate and affinity in Biacore terms A d [AB] dt dR dt RU/s ka kd B ka AB kd [A] [B] ka C [R max R] M-1s-1 M RU [AB] kd R s-1 RU A has one binding site and reacts with immobilized ligand B has n identical and independent binding sites 9 / GE Biacore T100 training_kinetics / 3/ GE / The net rate equation terms in a sensorgram 10 / GE Biacore T100 training_kinetics / Information in a Sensorgram The relationship between Rmax, Req and KD 11 / GE Biacore T100 training_kinetics / Mass transport A phenomenon with relevance to kinetics measurements in Biacore • Describes the movement of molecules from solution to a surface • Is independent of biomolecular interaction processes Rates measured in Biacore depend on both mass transport and biomolecular binding • The relative importance of mass transport effects can be largely controlled by the assay conditions used 12 / GE Biacore T100 training_kinetics / 4/ GE / What is mass transport? Diffusive mass transport • Simple example in a static system analyte gradient Over time, analyte concentration at the surface will be depleted and a gradient will be generated through the liquid layer 13 / GE Biacore T100 training_kinetics / Analyte consumption & supply flow cell height 1 diffusion distance 2 3 1. Analyte supplied by convection (continuous flow) 2. Diffusion becomes increasingly important as the flow rate reduces closer to the surface 3. Biomolecular interaction processes at the ligand/analyte interface 14 / GE Biacore T100 training_kinetics / Dealing with mass transport limitations Low Rmax (ligand density) High flow rates • High flow rates reduce diffusion distance Mass transport correction included in all kinetic models 15 / GE Biacore T100 training_kinetics / 5/ GE / Experimental Design Experimental design Affinity determination by steady-state analysis Determine steady state binding levels over a range of analyte concentrations High immobilization level Concentration range should cover at least 20-80% saturation of the surface Use reference surface Include at least one concentration in duplicate Include zero concentration sample 17 / GE Biacore T100 training_kinetics / Important experimental parameters Kinetic analysis The purity of the reagents Immobilization procedure Immobilization level Ligand activity Flow rate Analyte concentration range 18 / GE Biacore T100 training_kinetics / 6/ GE / Analyte concentrations Kinetic analysis Concentrations should cover a full range of binding curves Include at least one concentration in duplicate Include zero-concentration samples 19 / GE Biacore T100 training_kinetics / 1- What am I looking for? 1. Specificity? 2. Ranking? 3. Kinetics? 4. Concentration? 5. Thermodynamics? 6. Other? Collect information about interacting partners • MW • pI • stability • solubility • purity • activity 20 / GE Biacore T100 training_kinetics / 1- What am I looking for? 1. Specificity? 2. Ranking? 3. Kinetics? 4. Concentration? 5. Thermodynamics? 6. Other? Choose suitable immobilization chemistry and ligand density Wait for a stable baseline Check for drifts 21 / GE Biacore T100 training_kinetics / 7/ GE / 1- What am I looking for? 1. Specificity? 2. Ranking? 3. Kinetics? 4. Concentration? 5. Thermodynamics? 6. Other? Scout for buffer composition • pH • ionic strength • DMSO • metals • metal chelators • BSA • cofactors Keep it as simple as possible and match running buffer and sample buffer 22 / GE Biacore T100 training_kinetics / 1- What am I looking for? 1. Specificity? 2. Ranking? 3. Kinetics? 4. Concentration? 5. Thermodynamics? 6. Other? Check for a positive control • reproducibility • dose dependency • saturation • stoichiometry Check for a reference control • non specific binding • always check not subtracted signals • run zero concentrations and negative controls 23 / GE Biacore T100 training_kinetics / 1- What am I looking for? 1. Specificity? 2. Ranking? 3. Kinetics? 4. Concentration? 5. Thermodynamics? 6. Other? Scout for regeneration • from mildest to harsh, never the reverse • try with regeneration cocktails • always check for ligand activity and stability after regeneration 24 / GE Biacore T100 training_kinetics / 8/ GE / 1- What am I looking for? Adjust flow rate 1. Specificity? 2. Ranking? 3. Kinetics? 4. Concentration? 5. Thermodynamics? 6. Other? • mass transport limitation • rebinding Adjust injection parameters • association phase • dissociation phase 25 / GE Biacore T100 training_kinetics / Sensorgrams appearance •Take time to look at the shapes of the sensorgrams • Check for low quality data, such as drifts, air bubbles, spikes, aggregations • Always have a look at what happens on the reference flow cell and on the active, not just at the subtracted • Look at the curvatures of the sensorgrams if you are performing a kinetic analysis 26 / GE Biacore T100 training_kinetics / Have a look... A, B, C: Same kon but different koff D: Equilibrium reached within seconds E:Ligand saturation F: partial mass transport limitation Rich R and Myszka D, J. Mol. Recognit. 2008; 21: 355-400 27 / GE Biacore T100 training_kinetics / 9/ GE / More complexity... Is it a biphasic interaction? Maybe... But it is virtually impossible to resolve what actual event is leading to complex response SO Take a step back and riconsider experimental design and conditions 28 / GE Biacore T100 training_kinetics / Bad data sets Drifting baseline Substandard responses • ligand stability • perform start up • regeneration issues • aggregation • precipitation • instrument maintenance 29 / GE Biacore T100 training_kinetics / Data evaluation Yes/No data Specificity studies What is the purpose of the evaluation? Ranking Early selection of binders Equilibrium analysis KD Determination of binding strength Kinetic rate analysis ka, kd Modelling binding reactions to determine the dynamic behaviour of a system 30 / GE Biacore T100 training_kinetics / 10 / GE / Include zero-concentration samples “Double referencing” • Compensates for system disturbances • Important for high-quality work Sample Reference-subtracted Zero-conc Double-referenced 31 / GE Biacore T100 training_kinetics / Control experiments Non-specific binding Surface performance test Regeneration optimization Mass transport limitations Linked reactions 32 / GE Biacore T100 training_kinetics / Control experiments Vary contact time at equilibrium to check for linked reactions No linked reactions Linked reactions Dissociation rates are not affected by contact time if reactions are independent Two-state reactions and competition are examples of linked reactions 33 / GE Biacore T100 training_kinetics / 11 / GE / Summary B Affinity analysis A • Derives the affinity constants • For analysis of interactions with very fast on and off rates Kinetic analysis • Derives the rate constants and the affinity constants • For detailed characterization of a molecular interaction • Interactions with the same affinity may have entirely different association and dissociation rate constants • Rate constants may be more significant than affinity in understanding biological processes 34 / GE Biacore T100 training_kinetics / 12 / GE /
