Laboratory Report Guideline
advertisement
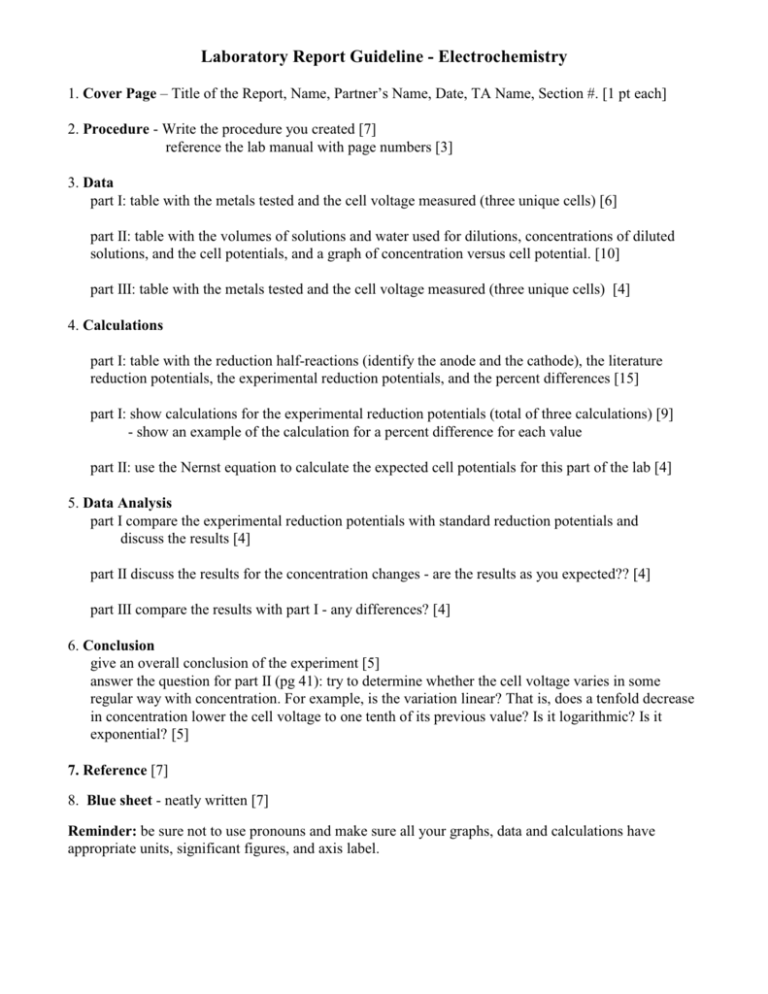
Laboratory Report Guideline - Electrochemistry 1. Cover Page – Title of the Report, Name, Partner’s Name, Date, TA Name, Section #. [1 pt each] 2. Procedure - Write the procedure you created [7] reference the lab manual with page numbers [3] 3. Data part I: table with the metals tested and the cell voltage measured (three unique cells) [6] part II: table with the volumes of solutions and water used for dilutions, concentrations of diluted solutions, and the cell potentials, and a graph of concentration versus cell potential. [10] part III: table with the metals tested and the cell voltage measured (three unique cells) [4] 4. Calculations part I: table with the reduction half-reactions (identify the anode and the cathode), the literature reduction potentials, the experimental reduction potentials, and the percent differences [15] part I: show calculations for the experimental reduction potentials (total of three calculations) [9] - show an example of the calculation for a percent difference for each value part II: use the Nernst equation to calculate the expected cell potentials for this part of the lab [4] 5. Data Analysis part I compare the experimental reduction potentials with standard reduction potentials and discuss the results [4] part II discuss the results for the concentration changes - are the results as you expected?? [4] part III compare the results with part I - any differences? [4] 6. Conclusion give an overall conclusion of the experiment [5] answer the question for part II (pg 41): try to determine whether the cell voltage varies in some regular way with concentration. For example, is the variation linear? That is, does a tenfold decrease in concentration lower the cell voltage to one tenth of its previous value? Is it logarithmic? Is it exponential? [5] 7. Reference [7] 8. Blue sheet - neatly written [7] Reminder: be sure not to use pronouns and make sure all your graphs, data and calculations have appropriate units, significant figures, and axis label.
