WHEN VOLATILITY SPIKES …
WILL YOUR PORTFOLIO BE READY?
Point of View With the Global Long/Short Equity Team
Until recently, stock market volatility had been at its lowest
level in years. While the end of the calm doesn’t mean it’s
time to exit stocks, it may well indicate that the time is right
for strategies that seek to provide growth while mitigating
volatility. Portfolio managers of BlackRock’s Global Long/
Short Equity Fund offer these observations:
}O ver the past 15 years, global stock markets have had
high correlations to one another and similar risk/return
characteristics.
}Long/short strategies tend to have a low correlation
with the broad stock market, offering the potential to
enhance diversification and reduce volatility.
Raffaele Savi, Managing Director, is responsible for BlackRock’s
Developed Market Equity Strategies within BlackRock’s
Scientific Active Equity Group
}Combining long and short investing in a single portfolio
can help limit exposure to market-related risks and expand
the investment universe.
}By aiming to take advantage of global stock market
inefficiencies, long/short strategies seek to profit in both
up and down markets.
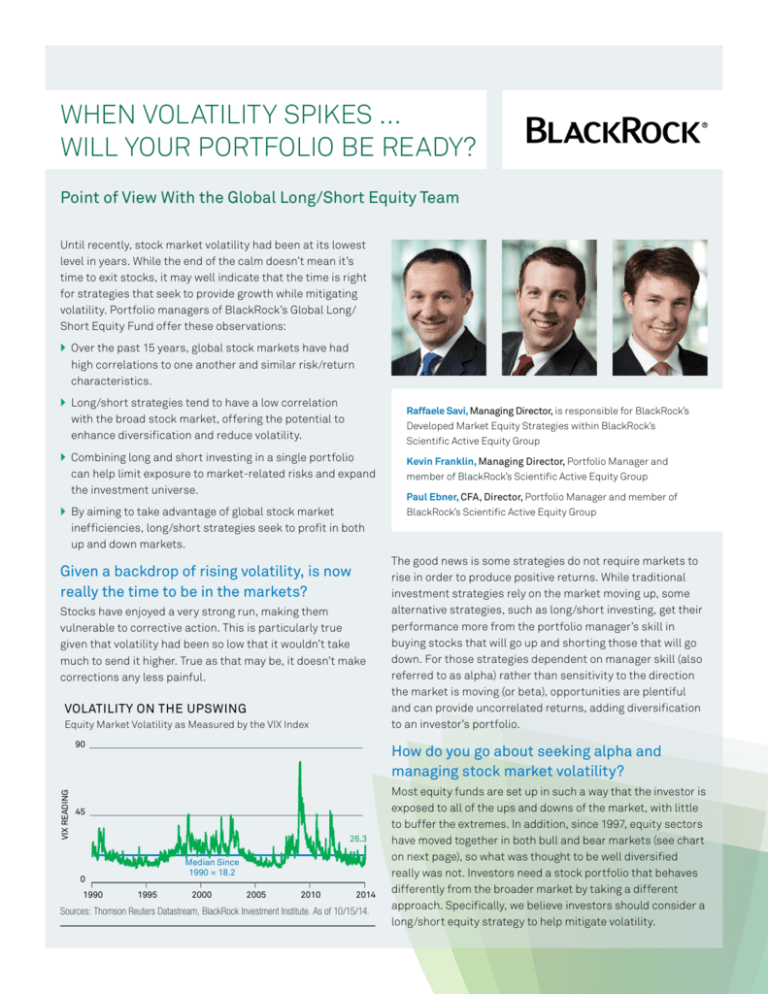
Given a backdrop of rising volatility, is now
really the time to be in the markets?
Stocks have enjoyed a very strong run, making them
vulnerable to corrective action. This is particularly true
given that volatility had been so low that it wouldn’t take
much to send it higher. True as that may be, it doesn’t make
corrections any less painful.
VOLATILITY ON THE UPSWING
Equity Market Volatility as Measured by the VIX Index
VIX READING
90
Paul Ebner, CFA, Director, Portfolio Manager and member of
BlackRock’s Scientific Active Equity Group
The good news is some strategies do not require markets to
rise in order to produce positive returns. While traditional
investment strategies rely on the market moving up, some
alternative strategies, such as long/short investing, get their
performance more from the portfolio manager’s skill in
buying stocks that will go up and shorting those that will go
down. For those strategies dependent on manager skill (also
referred to as alpha) rather than sensitivity to the direction
the market is moving (or beta), opportunities are plentiful
and can provide uncorrelated returns, adding diversification
to an investor’s portfolio.
How do you go about seeking alpha and
managing stock market volatility?
45
26.3
Median Since
1990 = 18.2
0
1990
Kevin Franklin, Managing Director, Portfolio Manager and
member of BlackRock’s Scientific Active Equity Group
1995
2000
2005
2010
2014
Sources: Thomson Reuters Datastream, BlackRock Investment Institute. As of 10/15/14.
Most equity funds are set up in such a way that the investor is
exposed to all of the ups and downs of the market, with little
to buffer the extremes. In addition, since 1997, equity sectors
have moved together in both bull and bear markets (see chart
on next page), so what was thought to be well diversified
really was not. Investors need a stock portfolio that behaves
differently from the broader market by taking a different
approach. Specifically, we believe investors should consider a
long/short equity strategy to help mitigate volatility.
ASSET CLASSES BEHAVE ALIKE
defend against. We believe this kind of strategy can offer
portfolio growth with less volatility.
Bull/Bear Risk and Return
60%
Bull Market
(9/02-10/07)
To be fair and balanced, there are risks. The effectiveness of
long/short strategies is not a given. There is the possibility
for increased volatility and for significant or total losses. It’s
important to work with an experienced manager.
Emerging Markets
40
International
RETURN
20
Small Cap
Mid Cap
Large Cap
You suggest developed stock markets are
inefficient. How?
0
-20
Mid Cap
-40
Small Cap
Large Cap
International
-60
0
10
Bear Market
(10/07-2/09)
20
Emerging Markets
30
40%
RISK (STANDARD DEVIATION)
Sources: BlackRock; Informa Investment Solutions. Past performance is no guarantee
of future results. It is not possible to invest directly in an index. Large Cap Stocks are
represented by the S&P 500 Index, Mid Cap Stocks by the S&P 400 Mid Cap Index,
Small Cap Stocks by the S&P 600 Small Cap Index, International Stocks by the MSCI
EAFE Index and Emerging Markets Stocks by the MSCI Emerging Markets Index.
Standard deviation is the measure of historical volatility of an investment calculated by
measuring past fluctuation of returns around the average return of the investment.
What is a long/short strategy?
A long/short equity investment strategy is a way of expressing
views on individual stocks. We buy (meaning we’re long)
stocks that we believe will appreciate in price. At the same
time, we sell (or short) borrowed stocks we believe will go
down in price. The intention of shorting is to buy the same
stocks back at a future date for a lower price, thereby
profiting from the difference.
Inefficiencies exist in every market. Conventional wisdom is
that developed stock markets efficiently and quickly price
stocks based on fundamentals. The reality is that pricing
inefficiencies occur all the time; they just don’t stay around for
very long in developed stock markets. But opportunities exist—
frequently when the connections aren’t obvious or direct. So
investors must find ways to enhance their understanding of
the fundamentals and relationships surrounding companies
to uncover those opportunities and stay ahead.
The way we look at it is when a balloon is squeezed smaller
at one end, it expands somewhere else. We see that in stock
markets: When one inefficiency is eliminated, a new
opportunity arises somewhere else.
Ultimately, what we’re trying to do is capture the ripple after
a stone drops in the water. Although we may not be able to
predict where the stone drops, we can forecast how we think
the ripples will play out. And we believe we have an
information advantage that allows us great insight into how
those ripples will develop.
Tell us about that “information advantage.”
What are the benefits of this approach?
We’d say our tools for accessing, consuming and analyzing
information are our greatest advantage. It simply leads to
better investing. We believe a scientific approach is
necessary to take advantage of the vast amount of publicly
available information out there—to process it all and make
sound trading decisions. The benefits of our scientific
approach include being able to bring a technological edge as
well as continuous evolution to our investment process.
A dedicated long/short approach effectively tries to take
advantage of the inefficiencies of global stock markets.
By matching both long and short equity positions, we have
the ability to dial up or down our exposure to market risk
from 0% (“market neutral”) to 40%. This means we seek
to deliver excess returns out of our investments, while
minimizing our exposure to broader market movements,
and the related volatility.
For example, our access to information relies on cuttingedge infrastructure to compile vast amounts of obvious and
less-obvious sources of publicly available information. In
fact, we consume a massive amount of data from more than
25 countries, with a storage capacity four times the Library
of Congress and eight times the size of Wikipedia. We take
that vast quantity of publicly available information and filter
and identify relevant pieces.
A key benefit of a dedicated long/short approach is the
increased number of opportunities available to us. We are
able to pinpoint precisely the companies we believe will
perform well, even if we don’t favor the industry they
participate in. It’s that herd mentality that we’re working to
The numbers are big—new information is mapped to more
than 1.7 million entities and 100 million connections—but it
is how we synthesize it that is a key advantage. We analyze
and interpret this vast array of data to provide daily rankings
and updates on the more than 2,500 companies we follow,
allowing us to make high-conviction investment decisions.
Regardless of whether the broad markets are rising or falling,
a long/short strategy is designed to profit from stocks that go
up and down. In so doing, it provides results that are different
from traditional U.S. and international equity markets, and
different from long-only (or “all-in”) strategies.
EXAMPLE 1: SEEING THE SIGNALS EARLY ALLOWS FOR DECISIVE ACTION
Fund Acted on Currency Movements in Mid-February
Research Analysts Did Not Adjust Estimates Until Late April
3
.30
2
Company X misses earnings
estimates, partially due to
currency headwinds
1
.25
0
-1
-2
Fund reached a 0.80% short position
-3
1/1/14
2/1/14
3/1/14
.20
1/27/14
4/1/14
Company X Currency Signal
3/27/14
4/17/14
Euro Strength
Sources: BlackRock, Bloomberg.
Can you provide examples?
We’d offer two. The first is a stock-specific case involving a
diversified technology company based in Europe (Company X
in the graphs above). The backdrop was this: In February 2014,
the euro began to strengthen, making euro-denominated
products more expensive for export and, therefore, putting
European companies at a disadvantage abroad. In mapping
the effects of currency values on future earnings of multinational companies, we saw that this particular company, a
large electronics exporter, was acutely disadvantaged relative
to peers. (97% of its revenue came from overseas.) This
prompted us to establish a short position in the stock early on,
before other analysts adjusted their estimates. The company
subsequently reported earnings well below expectations and
weak sales. The stock fell 5%, and we benefited from our
short position.
Currency fluctuations large enough to affect earnings are
relatively infrequent, but across a wide enough group of
stocks, it pays to track this. We track more than 2,500 firms
around the world to ensure things like currency movements
are correctly priced in.
The second example is a country-specific case involving
Spanish equities, which had hit a multi-year low in 2012. Our
systems process hundreds of analyst reports, and in the spring
of 2013, we noted that Spanish executives had increased their
use of specific and concrete words in earnings conference calls.
We have designed programs that can distinguish good words
from bad, and we carry that through to the analysis of a stock.
Our analysis further revealed that Spanish consumers had
started researching large purchases on the Internet. The
information we gathered led us to increase our long position in
those Spanish firms we felt could benefit from the burgeoning
change in sentiment.
Can you describe your investment process?
The Scientific Active Equity team has managed long/short
portfolios since 1996. We have team members in Asia,
EXAMPLE 2: GETTING AHEAD OF SPAIN’S RECOVERY
Spanish Stocks Rebounded in Q3 2013
Sentiment Increased Over the Course of Q2 2013
30%
1.2
RETURN OF IBEX
SPANISH EQUITY INDEX
SENTIMENT MEASURE
1.6
Sentiment
started picking
up in March
0.8
0.4
0.0
Stocks began
rising in June
20
10
0
-10
-0.4
12/12
2/13
4/13
Consumer Sentiment
Sources: BlackRock, Bloomberg.
6/13
8/13
10/13
Executive Sentiment
12/12
3/13
6/13
9/13
12/13
Europe, Australia and the United States, so the sun never
sets on our ability to monitor and trade markets. Our
investment process is built around this flexible global team
and based upon a systematic application of our research
based on three buckets: earnings quality, sentiment and
relative valuation. Combining these factors offers us a
comprehensive view of how likely it is that a given stock
is going to outperform (or underperform) its peers over the
next three to 12 months.
How should investors incorporate this
strategy into a portfolio?
And we are tireless in looking for more and better public
information about companies, ways of knowing it sooner
and improving our understanding of that information. Over
the course of 18 years, our team has changed and evolved
the inventory of hundreds of signals and investment
classifications to stay ahead of market changes. For example,
our ability to consume research reports, conference calls and
filings has gone through three generations of improvements.
} Increases exposure to equity-like returns, but with
lower volatility.
Indeed, evolution is central to our process. We know that
finding the less-obvious investment opportunity requires
resources and skill, so we are constantly investing in our
technology, expertise and people to maintain our competitive
advantage and evolve our investment research strategy.
} Low correlation complements U.S. equity holdings.
We see it as a building block that can add meaningful
diversity to a broader portfolio of stock funds, particularly in
a tax-efficient account. By incorporating a long/short
strategy into a traditional equity portfolio, investors can help
reduce volatility and enhance returns. More specifically:
For investors looking for greater growth potential:
}Low correlation serves as a nice complement to
traditional equities.
For investors underallocated to international equities:
} Increases exposure to global equities, but with less
exposure to global market risk.
For investors preparing for retirement:
} Equities’ higher return potential (vs. bonds) can enhance a
retirement portfolio.
}Increases exposure to the growth potential of equities,
but with lower volatility.
Investment involves risks. Stock values fluctuate in price so the value of your investment can go down depending on market
conditions. International investing involves additional risks, including risks related to foreign currency, limited liquidity, less
government regulation and the possibility of substantial volatility due to adverse political, economic or other developments.
Long/short investing entails special risks. Short sales in securities that increase in value can cause a loss of principal. Any
loss on short positions may or may not be offset by investing short sale proceeds in other investments. Long/short strategies
present the possibility of significant or total losses, and that the long and short strategies may not perform, potentially adding
to volatility and losses. Investing in derivatives entails specific risks relating to liquidity, leverage and credit that may reduce
returns and/or increase volatility.
This material is not intended to be relied upon as a forecast, research or investment advice, and is not a recommendation, offer or solicitation to buy or sell any securities or to adopt any investment
strategy. The opinions expressed are those of the portfolio managers profiled as of November 2014, and may change as subsequent conditions vary. Individual portfolio managers for BlackRock may
have opinions and/or make investment decisions that may, in certain respects, not be consistent with the information contained in this report. The information and opinions contained in this material are
derived from proprietary and non-proprietary sources deemed by BlackRock to be reliable, are not necessarily all-inclusive and are not guaranteed as to accuracy. Past performance is no guarantee
of future results. There is no guarantee that any forecasts made will come to pass. Reliance upon information in this material is at the sole discretion of the reader.
For a current prospectus or, if available, a summary prospectus of any BlackRock mutual fund, which contains more complete
information, please call your financial professional or BlackRock at 800-882-0052. Before investing, consider the investment
objectives, risks, charges and expenses of the fund(s) under consideration. This and other information can be found in each
fund’s prospectus or, if available, summary prospectus. Read each prospectus carefully before you invest.
FOR MORE INFORMATION: www.blackrock.com
©2014 BlackRock, Inc. All Rights Reserved. BLACKROCK is a registered trademark of BlackRock, Inc.
All other trademarks are those of their respective owners.
Prepared by BlackRock Investments, LLC, member FINRA.
Not FDIC Insured • May Lose Value • No Bank Guarantee
Lit. No. GLSE-POV-1114
2645A-RET-1114 / USR-4891


![[These nine clues] are noteworthy not so much because they foretell](http://s3.studylib.net/store/data/007474937_1-e53aa8c533cc905a5dc2eeb5aef2d7bb-300x300.png)

