Las Vegas Sands Management
advertisement
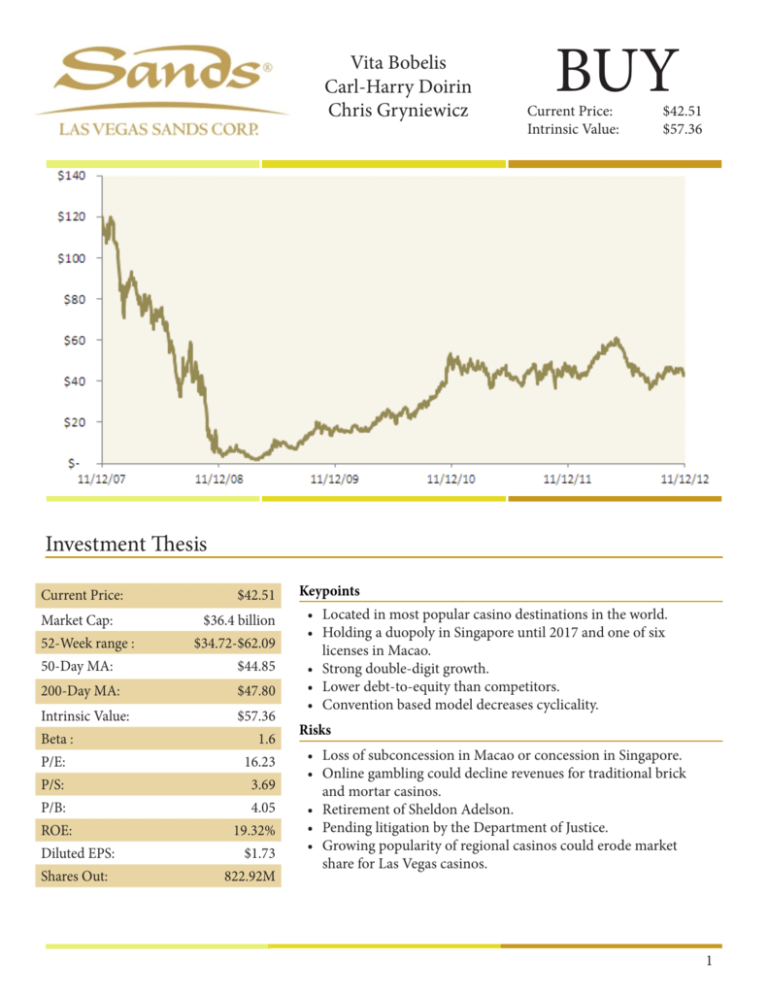
Vita Bobelis Carl-Harry Doirin Chris Gryniewicz BUY Current Price: Intrinsic Value: $42.51 $57.36 Investment Thesis Current Price: Market Cap: 52-Week range : $42.51 $36.4 billion $34.72-$62.09 50-Day MA: $44.85 200-Day MA: $47.80 Intrinsic Value: $57.36 Beta : 1.6 P/E: 16.23 P/S: 3.69 P/B: 4.05 ROE: Diluted EPS: Shares Out: 19.32% $1.73 822.92M Keypoints • Located in most popular casino destinations in the world. • Holding a duopoly in Singapore until 2017 and one of six licenses in Macao. • Strong double-digit growth. • Lower debt-to-equity than competitors. • Convention based model decreases cyclicality. Risks • Loss of subconcession in Macao or concession in Singapore. • Online gambling could decline revenues for traditional brick and mortar casinos. • Retirement of Sheldon Adelson. • Pending litigation by the Department of Justice. • Growing popularity of regional casinos could erode market share for Las Vegas casinos. 1 Company Profile Las Vegas Sands Corp (LVS) is a leading global developer of resort properties that feature premium accommodations, world-class gambling, entertainment, and retail, convention and exhibition facilities, celebrity chef restaurants and other amenities. Founded in 1988 by Sheldon Adelson, the company’s geographic diversity, best-in-class properties, and convention-based business model have allowed it to establish an impressive platform in the hospitality and gaming industry. Its unique conventionbased marketing strategy allows it to attract business travellers during the slow mid-week periods, while leisure travelers fill its properties during the weekends. LVS was awarded one of six subconcessionaires to operate four resorts in Macao: The Venetian Macao, The Four Seasons Macao, The Sands Macao, and The Sands Cotai Central which opened its second phase in September of 2012. The Macao properties have approximately 822,000 square feet of gaming space, 1,140 game tables, 3,280 slot machines, and upon completion of the Sands Cotai Central will have well over 9,900 luxurious suites. In Singapore, Las Vegas Sands was awarded one of two concessions to develop and operate two integrated resorts. Ideally positioned to cater to both business and leisure travelers in Singapore, the Marina Bay Sands features 2,600 suites in three elegant hotel towers, 160,000 square feet of gaming space, 600 gaming tables, and 2,500 slot machines. The company’s Las Vegas properties include The Venetian Las Vegas, The Palazzo, and The Sands Bethlehem. Combined, these properties feature over 11,000 rooms and suites, 377,000 square feet of gaming space, 340 table games, and 5,700 slot machines. With over 2.3 million gross square feet of state-ofthe-art exhibit and convention rooms, the Sands Expo Center is one of the world’s largest trade show and convention facilities. Macreconomic Analysis Quantitative easing measures taken by central banks will allow easier access to capital, resulting in higher spending. We anticipate higher demand among consumer discretionary segments due to an emerging global middle class. Greater acceptance of gambling, as indicated by a recent Gallup poll, growing popularity of online gambling, and the World Series of Poker will likely lead to higher casino visitation worldwide. Highly leveraged nations are considering the relaxation of gambling regulations in an effort to raise tax revenue. 2 Industry Analysis Global Casino Revenue Breakdown 2011 2015 in the US, has not seen the market share erosions from regional casinos. Las Vegas will be inversely affected by growth in Asian markets, as it competes with these regions as a global destination for gambling. We anticipate revenue gains averaging 5% each year, to $13 billion in 2015 from $10.4 billion in 2010. Online Gambling In 2011, global casino revenue rose 9.6%. Both EMEA (Europe, Middle East, and Africa) and Canada saw declines of 7.2% and 2.9%. Asia Pacific recorded the most dramatic improvement, led mostly by new markets in Singapore and Macao, increasing revenues by 49.7% over the prior year. Both Latin America and the United States saw modest growth of 5.5% and 5.1%. Spending in Latin America is expected to improve as new casinos are established in the region. We expect casino revenue across the US, EMEA, Asia Pacific, Latin America, and Canada to grow at 9.2% CAGR for the next five years, rising from $117.6 billion in 2010 to $182.8 billion in 2015. Our projections assume strong growth in Asia to result in 43% of the market share by 2015. Logistical improvements including a new railway to connect Macao to Guangzhou and a road bridge from Hong Kong through Zhuhai and Macao to be major catalysts for growth. Singapore has experienced strong growth since eliminating anti-gambling regulation in 2009. We expect revenues to increase to $7 billion in 2015 from $4 billion in 2011. Casino revenues in the United States declined during the Great Recession, which led to many developers stalling projects for new facilities. As consumer discretionary spending increased during 2010 and 2011, revenues have returned to their pre-recessionary levels. We expect steady growth in this region, which is the result of improving economic conditions and more Americans viewing gambling as a morally acceptable activity. Atlantic City’s market share has been eroded by growth in the regional casino market, especially by facilities built in Pennsylvania. We expect this trend to continue during our forecast period. Atlantic City’s 2015 revenues are likely to be below their 2010 levels. Las Vegas, which relies on players from overseas more than other casinos Since the global financial crisis, views on online gambling have been more positive, due to its tax revenue generating ability. We expect federal legislation to be passed in the United States to legalize and regulate online poker during our forecast period. Two pieces of current legislation in the United States prohibit online gambling. The Federal Wire Act of 1961 bans the placing of sports bets over the telephone. On April 15, 2011, a federal grand jury in New York used this law to shut down PokerStars, Full Tilt Poker, and Absolute Poker / Ultimate Bet. The Unlawful Internet Gambling Enforcement Act (UIGEA) of 2006 prohibits banks and other institutions from transferring funds to offshore gaming sites in support of illegal online gaming. We expect that online gambling will be implemented during our forecast period and it will resemble a 2010 bill proposed by Senator Harry Reid. The proposal will allow casino companies to set up their own online poker sites, exempt from UIGEA, for their customers to use. 3 Legislation and Regulation Macao LVS entered into a subconcession agreement with Galaxy which allowed it to develop and operate certain casino projects in Macao. Under the agreement, which expires in June 2022, the company is subject to licensing and control under applicable Macao law and is obliged to pay the government an annual premium with a fixed portion (approximately $3.7 million) and a variable portion (approximately $5.6 million) based on the number and type of gaming tables employed and gaming machines operated. LVS must pay a special gaming tax of 35% of gross gaming revenues and applicable withholding taxes. It must also contribute 4% of gross gaming revenue to utilities designated by the Macao government, a portion of which must be used for promotion of tourism in Macao. Singapore Marina Bay Sands Pte. Ltd.(MBS), a subsidiary of Las Vegas Sands, holds one of two concessions to develop and operate the Marina Bay Sands. As a result of the Development Agreement, restrictions limiting the use of the leased land to the development and operation of the project. It requires MBS to invest at least $2.96 billion in the integrated resort, to be allocated in specified amounts among the casino, hotel, retail, convention facilities, etc. by 2013. There is a goods and services tax of 7% imposed on gross gaming revenue and a casino tax of 15% imposed on the gross gaming revenue from the casino after the reduction for the amount of goods and services tax. The casino tax is deductible against the Singapore corporate taxable income. State of Nevada LVS is licensed by the Nevada Gaming Authorities to operate both The Venetian Las Vegas and The Palazzo as a single resort hotel as set forth in the Nevada Act. The license requires periodic payment of fees and taxes. Depending on upon the particular fee or tax involved, they are typically based upon a percentage of gross revenue received, the number of gaming devices operated, or the number of table games operated. The tax on gross revenue received is generally 6.75%, and an excise is paid on charges for admission to any facility where certain forms of live entertainment are provided. The Nevada Act requires any person who acquires more than 5% of voting shares to report the acquisition to the Nevada Commission. Commonwealth of Pennsylvania Sands Bethworks Gaming is subject to the rules and regulations promulgated by the Pennsylvania Gaming Control Board (PaGCB) and the Pennsylvania Department of Revenue, the on-site direction of the Pennsylvania State Police and the requirements of other agencies. The company must inform the PaCGB of any contemplated change of control. Pending Litigation Las Vegas Sands is involved in a lawsuit with the former CEO of Sands China, Steve Jacobs, who claims he was wrongfully terminated. Jacobs is seeking roughly $100 million in damages. Additionally the justice department is investigating LVS for money laundering. In 2007, plans for the Adelson Center for U.S.China Enterprise in Beijing were announced. Its purpose was to aid U.S. businesses in expanding into Chinese markets. The center never opened, due to the economic downturn in 2008 and a management change at Las Vegas Sands. It is now under scrutiny by the Justice Department, the Securities and Exchange Commission, and the company’s audit committee for possible violations of the Foreign Corrupt Practices Act. In early November, the company and justice department are in discussion to settle the charges that could result in Las Vegas Sands paying a fine and changing the way it handles customer money, in exchange for prosecutors dropping their threat to indict the company. 4 Las Vegas Sands Revenue Analysis Total Revenue Growth Matrix 2006 2007 2008 2009 2010 2007 24% Over the past 5 years, Las Vegas Sands has seen impressive double- digit revenue growth, apart from 2009, when the company recorded a mere 4% growth over 2008. The company believes it can maintain double digit level growth through expansionary projects in Asia. Las Vegas Sands’ revenues come primarily from 2008 49% 33% 2009 51% 35% 5% 2010 67% 57% 36% 33% casino operations followed by room revenue. Since beginning operations in Asia, LVS has gained significant market share from the area with an astounding 57% of its casino revenues coming from Macao in 2011, the second largest majority being made up from Singapore. Surprisingly, its Las Vegas properties made up merely 2011 76% 69% 53% 52% 27% 6% of casino revenue, though it holds the largest portion of revenue from rooms and suites. With continued expansion and maturity as premier vacation locations in Asia, we expect Macao and Singapore to continue to make up the majorities of casino revenues and increase their share of room revenue. Casino Revenue by Region Total Revenue Breakdown Room Revenue by Region Revenue Growth 5 Porter’s 5 Forces Analysis Buyer Power - Low Buyer power is low, due to a large number of customers with small transactions per customer. Casinos increase switching costs and build brand loyalty by enticing customers through VIP and rewards programs and offering differentiated slot machines or tables. Buyer power is reduced further by lack of rational decision making from gambling addiction further decreasing the ability of consumers to impact pricing. Supplier Power – Moderate Large supplier companies such as International Game Technology (IGT), WMS Industries and Shuffle Master hold power as they produce top of the range machines, which consumers want to play. As the industry has shifted globally, foreign firms are entering into game manufacturing, which weakens supplier power. Threats of New Entry – High Regulation in the casino industry is a major barrier to entry. Growing popularity of gambling led to an increased acceptance, which resulted in more casinos. Until 1985, casinos were legal only in Nevada and Atlantic City, but today 12 states allow commercial land-based casinos, while 29 states have Native American reservation casinos. Gambling in Mainland China is illegal. Recently the Chinese people have been permitted to visit Macao, where gambling is legal. As such, the area is booming and is often described as ‘Asia’s Las Vegas’. Singapore lifted its 40-year long gambling ban in 2005, which allowed casinos in the country to be opened in 2010. In Europe, gambling has not been widely accepted. Tax levies on market players in many European countries are higher than other parts of the world; consequently, many players may wish to operate in other geographies. In some German states, gambling taxes run as high as 92% of net income and make it difficult to survive even in times of economic prosperity. Substitutes – High Any leisure activity can act as a substitute with minimal switching costs. Online gambling is also an option. Competitive Rivalry – High In 2012, the four largest firms in the Casino Hotels industry will account for about 38.0% of the available market share, indicating a low to medium concentration in the industry. The merger of Caesars Entertainment Corporation with Harrah’s Entertainment Inc secured the dominant positions in the industry. Industry consolidation has been a major trend. The level of industry concentration has increased significantly since 2007, it is now expected stabilize over the next five years due to state regulatory constraints in the industry and to the monitoring of federal government agencies over industry competition levels. 6 Las Vegas Sands Management Sheldon Adelson Since founding the company in 1988, Mr. Adelson has been the CEO, Chairman, and Director of Las Vegas Sands. Prior to founding the company, Adelson built COMDEX computer trade show which sold for $850 million. He and his family are the principal stockholders owning approximately 52% of LVS’s outstanding common stock. Compensation: $13,845,056 Kenneth Kay Kenneth Kay has held the positions of Chief Financial Officer and Executive Vice President since 2010. Before joining the company, Mr. Kay served as Senior Executive Vice President and Chief Financial Officer of CB Richard Ellis Group, Inc from 2002 through 2008 and from 1999 through 2002 he was the Vice President and Chief Financial Officer of Dole Food Company. Compensation: $2,441,362 Michael Leven Michael Leven has held a number of positions within Las Vegas Sands. He has been the President and Chief Operating Officer since 2009, Secretary since 2010 and a director of the company since 2004. Mr. Leven has been the acting Chief Executive Officer and member of the Board of Directors of the company’s subsidiary, Sands China Ltd. since July 2010. He also serves on various boards including Hersha Hospitality Trust, and a number of nonprofits. Compensation: $23,513,560 Robert G. Goldstein Robert G. Goldstein joined the company in 1995 and has held a number of positions. He has been the Executive Vice President since 2009 and President of Global Gaming Operations since 2011. He previously served as the Senior Vice President of the company from 2004-2009 and was the Executive Vice President of the company’s predecessor, Las Vegas Sands, Inc., since 2009 and its Senior Vice President from 1995 thru 2009. Compensation: $9,325,795 John Caparella John Caparella has been the President and Chief Operating Officer of Venetian Casino Resort, LLC and Sands Expo & Convention Center, Inc., and Senior Vice President of Las Vegas Sands, LLC since 2011. Before joining LVS, Mr. Caparella served as the Executive Vice President of Gaylord Entertainment Company and Chief Operating Officer of Gaylord Hotels. Compensation: $3,115,388 Management Analysis Sheldon Adelson has effectively managed LVS thus far. We do not anticipate any complications due to CEO duality. Adelson is currently 79 years old with no serious health problems reported. A successor is not apparent. Las Vegas Sands has a staggered board of directors, which is common in the United States. Current compensation for senior management is on par with other large gaming companies. 7 SWOT Analysis Strengths • Geographically diversified within the most popular casino destinations in the world. LVS has a duopoly in Singapore and has one of only six licenses in China which is currently the largest gambling markets in the world. • Financial health has been improving substantially since the recession and is financially better than its competitors • Accessibility- More than 1.0 billion people are estimated to live within a three-hour flight from Macao and more than 3.0 billion people are estimated to live within a five-hour flight from Macao. Weaknesses • The proliferation of gaming in California and other areas located in the same region as LVS’s Las Vegas Operating Properties could have an adverse effect on its financial condition, due to operations or cash flows • The legalization of casino gaming in or near major metropolitan areas may cause customers to forgo travel to Las Vegas. • Actual study shows fewer people are willing to visit Las Vegas if casinos are built near their cities. • The company does not own 1 of 3 concessions given by the Macao government but rather owns a sub concession from Galaxy. • Exemption from Macao’s corporate income tax on profits generated by the operation of casino games of chance ends in December 31, 2013. • Sheldon Adelson political affiliation. Opportunity • • • • A proposed bridge is expected to reduce the travel time between central Hong Kong and Macao. Macao draws a significant number of customers who are visitors or residents of Hong Kong. LVS’s biggest share of revenue is Macao; it is building the biggest tourist complex in the world. With about 85% of its business leveraged towards Asian gaming, LVS stands to gain big from the current stimulus programs being implemented in China. Threats • The Macao government, with the consent of Galaxy, may terminate the subconcession under certain circumstances. • In the event of a default, the casinos and gaming-related equipment would be automatically transferred to the Macao government without compensation to LVS would cease to generate any revenues from these operations. • The sub concession agreement expires on June 26, 2022. Unless it is extended, on that date, the casinos and gaming-related equipment will automatically be transferred to the Macao government without compensation to LVS. • LVS must renew its gaming license next year with the relevant gaming authorities in Singapore. • LVS is currently under investigation for violation of the Federal Corrupt Practices Act 8 Competitors MGM Resorts International MGM Resorts is the largest gaming and hotel company in the Las Vegas Strip gaming market, with more than 40,000 guest rooms and suites on the Strip, representing approximately 30% of all guest rooms in the market. The company’s Vegas properties include Bellagio, MGM Grand, Mandalay Bay, Mirage, Luxor, New York-New York, and a 50% ownership stake in CityCenter. Strip revenue comprises approximately 80% of revenue. Wynn Resorts Limited Steve Wynn founded the company in 2002 and now operates four megaresorts: Wynn Macau and Encore in China, and Wynn Las Vegas and Encore on the Las Vegas Strip. The company is currently in the design phase for a fifth casino and resort on the Cotai Strip in Macau. Caesars Entertainment Corporation Caesars is owned by Hamlet Holdings, a joint venture of Apollo Global Management and Texas Pacific Group, with Blackstone Group holding a minority stake. The name change from “Harrah’s Entertainment Inc.” to “Caesars Entertainment Corporation” was made official on November 23, 2010. On November 5, 2010, Harrah’s announced an IPO of 31,250,000 shares but retracted this offering on November 19. Caesars owns 52 properties internationally, which include land-based casino hotels, riverboat casinos, and Native American casinos. Since its IPO in February, share price has fallen 53%. Caesars, with debt of over $19 million, has more than triple the burden of Las Vegas Sands (LVS) and about six times the debt of Wynn Resorts (WYNN). Ratio Analysis LVS Liquidity Ratios Casino Industry Ratio Comparison Las Vegas Sands has maintained its ability to cover short-term obligations despite investing in growth opportunities and the economic downturn. Its current ratio has been well above two over the past three years. LVS has the strongest liquidity ratios for the industry. 9 Ratio Analysis (cont.) LVS Solvency Ratios Profitability Ratios Casino Industry Las Vegas Sands has been improving its times interest earned ratio. A higher value is favorable indicating a greater ability to repay its interest and debt. We expect further improvements to EBIT will increase the company’s ability to pay off its loans. In terms of profitability, Las Vegas Sands is a leader amongst its peers, due to its ideal global locations. After a decline in 2008, profitability numbers have been rebounding strongly. Las Vegas Sands DuPont Analysis Casino Industry DuPont Analysis The Extended DuPont model identifies the factors leading to LVS’s increasing ROE. Since 2008, the company has substantially improved net profit margin and reduced borrowing. During our forecast period, we expect LVS to keep reducing its debt and improving margins. Ratio Comparison Beta Operating Margin Profit Margin Return On Asset Return On Equity Debt to Equity LVS 1.6 23.11% 14.39% 7.21% 19.32% 0.92 WYNN 1.62 20.49% 11.16% 9.12% 50.47% 9.17 MGM 2.34 9.70% -6.83% 1.96% -4.11% 1.42 10 Price to Sales Valuation 5 Year Casino Price to Sales Ratios LVS WYNN MGM 2007 12.43 4.7 3.26 2008 .53 1.55 .53 2009 2.15 2.3 .57 2010 5.31 3.08 1.1 2011 3.69 2.63 .75 Average 4.82 2.85 1.24 2013 P/S Valuation Projected Sales: Shares Outstanding: Sales per Share: P/S Multiple: Price per Share: Probability: Weighted Average Price: 15% Revenue Growth $12,489,037,000 822,920,000 $15.18 4.82 $73.15 15% 8% Revenue Growth $10,163,604,600 822,920,000 $15.18 4.82 $59.53 50% $60.03 2% Revenue Growth $9,410,745,000 822,920,000 $15.18 4.82 $55.12 35% We calculated the five-year average P/S value for Las Vegas Sands. Projected sales were taken from the Proforma Income Statement and were divided by shares outstanding to obtain sales per share, which was multiplied by the five-year P/S multiple to determine projected price per share. For our scenario analysis, we assigned weights and calculated the expected value based on those weights. Discounted Cash Flow Valuation Dividend Discount Model Dividend per Share: Present Value: Intrinsic Value: 2012 2013 2014 2015 2016 2017 2018 2019 2020 Terminal Value $1.00 $1.40 $1.68 $2.02 $2.42 $2.66 $2.93 $3.22 $3.54 $89.81 $1.29 $1.43 $1.58 $1.75 $1.77 $1.79 $1.82 $1.84 $43.10 $57.36 A 3-stage growth Dividend Discount Model was used to derive an intrinsic value of $57.36 for Las Vegas Sands. The capital asset pricing model was used to calculate a discount rate of 8.5%, which was used through the first 10 years of our model, followed by a terminal discount rate of 10% and a terminal growth rate of 5%. 11 $(185,571) $(354,479) $(354,479) $14,264 $23,248 $(3,884) $321,870 $(372,627) $(50,757) $(31,218) $1,017,042 $1,705,771 $(28,740) $688,196 $533 2009 $4,563,105 $2,876,873 $1,686,232 $407,463 $(191,931) $599,394 $599,394 $(182,209) $18,555 $74,302 $306,813 $855,905 $1,162,718 $(56,423) $923,623 $1,758,854 $1,180,586 $833,448 $1,783 2010 $6,853,182 $3,875,187 $2,977,995 $1,269,508 $(290,615) $1,560,123 $1,560,123 $(322,996) $22,554 $211,704 $282,949 $2,094,823 $2,377,772 $(22,318) $1,010,685 $2,087,978 $2,389,887 $1,065,984 $11,309 2011 $9,410,745 $4,922,677 $4,488,068 $1,734,589 - $1,734,589 $1,734,589 $(325,235) $21,452 $(180,809) $257,157 $1,928,103 $2,185,260 $(102,915) $947,918 $3,132,415 $2,288,174 $2,168,236 $16,262 2012E $10,841,178 $5,420,589 $5,420,589 $1,998,246 - $1,998,246 $1,998,246 $(374,671) $20,854 $254,176 $278,549 $2,541,759 $2,644,674 $(102,915) $980,389 $3,496,930 $2,747,588 $2,497,807 $18,734 $2,301,979 - $2,301,979 $2,301,979 $(431,621) $21,620 $295,939 $300,912 $2,959,393 $3,062,307 $(102,915) $1,129,409 $4,028,464 $3,165,222 $2,877,474 $21,581 $2,651,880 - $2,651,880 $2,651,880 $(497,228) $21,309 $344,051 $323,994 $3,440,506 $3,543,421 $(102,915) $1,301,079 $4,640,790 $3,646,335 $3,314,850 $24,861 2015E $16,574,251 $8,287,126 $8,287,126 $3,054,966 - $3,054,966 $3,054,966 $(572,806) $21,261 $399,475 $347,424 $3,994,749 $4,097,664 $(102,915) $1,498,843 $5,346,191 $4,200,578 $3,818,708 $28,640 2016E $19,093,538 $9,546,769 $9,546,769 2013E 2014E $12,489,037 $14,387,371 $6,244,519 $7,193,686 $6,244,519 $7,193,686 $(540,050) Income Statement Total Revenue Cost of Revenue Gross Profit Research Development Selling General and Administrative Other Operating Expenses Operating Income Total Other Income/ Expenses Net Earnings Before Interest And Taxes Interest Expense Income Before Tax Income Tax Expense Minority Interest Other Net Income From Continuing Ops Net Income Preferred Stock And Other Adjustments Net Income Applicable To Common Shares 12 Liabilities Accounts Payable Short/Current Long Term Debt Total Current Liabilities Long Term Debt Other Liabilities Deferred Long Term Liability Charges Minority Interest Total Liabilities Total Current Assets Property Plant and Equipment Other Assets Total Assets Net Receivables Inventory Other Current Assets Current Assets Cash And Cash Equivalents $410,834 $234,607 $660 $473,833 $5,141,599 $1,089,888 $14,310,573 $887,219 $952,086 $1,839,305 $10,852,147 $81,959 $447,274 $5,623,674 $13,351,271 $1,597,161 $20,572,106 $487,208 $27,073 $35,336 $5,074,057 2009 $6,662,991 $503,379 $207,356 $708 $880,703 $5,574,224 $1,268,197 $13,877,938 $1,316,364 $1,284,049 $2,600,413 $9,373,755 $78,240 $557,333 $4,058,907 $14,502,197 $2,483,204 $21,044,308 $778,525 $32,260 $46,726 $3,201,396 2010 $7,850,689 $733 $2,145,692 $5,704,264 $1,588,463 $14,393,434 $1,682,951 $815,755 $2,498,706 $9,577,131 $89,445 $639,689 $5,397,152 $15,030,979 $1,815,992 $22,244,123 $1,409,009 $34,990 $45,607 $3,907,546 2011 $8,821,320 $5,761,307 $733 $3,059,281 $1,913,698 $13,231,980 $1,259,928 $857,189 $2,117,117 $8,571,886 $100,000 $529,279 $5,513,325 $14,334,645 $2,205,330 $22,053,300 $1,957,618 $40,239 $44,107 $3,471,362 2012E $9,727,779 $5,818,920 $733 $3,908,126 $2,288,369 $14,591,669 $1,406,170 $928,497 $2,334,667 $9,284,966 $100,000 $583,667 $6,079,862 $15,807,641 $2,431,945 $24,319,448 $2,158,093 $46,274 $48,639 $3,826,856 2013E $10,708,668 $5,877,109 $733 $4,830,826 $2,719,991 $16,063,002 $1,567,039 $1,003,041 $2,570,080 $10,030,411 $100,000 $642,520 $6,692,917 $17,401,585 $2,677,167 $26,771,669 $2,374,881 $53,215 $53,543 $4,211,278 2014E $11,764,183 $5,935,880 $733 $5,827,570 $3,217,218 $17,646,275 $1,743,424 $1,079,980 $2,823,404 $10,799,802 $100,000 $705,851 $7,352,614 $19,116,797 $2,941,046 $29,410,458 $2,607,978 $61,198 $58,821 $4,624,618 2015E $12,892,345 $5,995,239 $733 $6,896,373 $3,790,024 $19,338,517 $1,936,084 $1,158,079 $3,094,163 $11,580,789 $100,000 $773,541 $8,057,715 $20,950,060 $3,223,086 $32,230,862 $2,856,884 $70,377 $64,462 $5,065,993 2016E Balance Sheet Stockholders’ Equity Misc Stocks Options Warrants Redeemable Preferred Stock Preferred Stock Common Stock Retained Earnings Treasury Stock Other Stockholder Equity $5,850,699 Period Ending Assets Total Stockholder Equity 13 Period Ending Net Income $637,906 $379,945 $(178,746) $241,812 $1,759 $(75,320) 2009 $(354,479) $772,707 $320,918 $(332,924) $400,622 $(4,941) $(67,834) 2010 $599,394 $876,540 $335,232 $(789,163) $389,582 $(2,841) $(29,973) 2011 $1,560,123 $976,540 $335,232 $(748,609) $870,346 $(5,249) $(50,000) 2012E $1,734,589 $1,076,540 $375,000 $(400,475) $535,824 $(6,036) $(50,000) 2013E $1,998,246 $1,276,540 $400,000 $(416,788) $1,031,215 $(6,941) $(50,000) 2014E $2,301,979 $1,476,540 $400,000 $(433,097) $712,209 $(7,982) $(50,000) 2015E $2,651,880 $1,676,540 $400,000 $(448,906) $1,223,875 $(9,180) $(50,000) 2016E $3,054,966 Statement of Cash Flows Operating Activities, Depreciation Adjustments To Net Income Changes In Accounts Receivables Changes In Liabilities Changes In Inventories Changes In Other Operating Activities $5,847,295 $(750,000) $217,000 $4,749,550 $(750,000) $217,000 $(533,000) $4,536,005 $(1,000,000) $217,000 $(533,000) $(1,986,163) $(859,087) $(16,871) $3,529,099 $(1,000,000) $217,000 $(783,000) $(1,655,136) $(846,330) $(16,871) $3,112,849 $(1,650,000) $217,000 $(783,000) $(1,379,280) $(819,990) $(16,871) $2,662,496 $(2,092,896) $(2,023,981) $(1,508,493) $82,833 $(683,834) $810,387 $(1,433,000) $(1,149,400) $(784,388) $(16,871) $(2,862,121) $(3,000) $1,870,151 $(698,106) $(821,000) $(963,812) $(16,871) $(2,518,337) $(13,292) $638,613 Investing Activities Capital Expenditures Investments Other Cash flows from Investing Activities $(2,010,063) $(2,707,815) $(75,297) $(817,692) $(98,775) $(16,871) $(2,216,141) $(13,292) Total Cash Flow From Operating Activities Total Cash Flows From Investing Activities $(93,400) $241,969 $(1,203,582) $(6,579) $(1,950,659) $(3,292) $(94,697) $2,386,479 $1,054,556 - $(1,801,683) $(5,292) Financing Activities Dividends Paid Sale Purchase of Stock Net Borrowings Other Cash Flows from Financing Activities $(1,127,557) $(1,093,461) $46,886 $(5,292) $3,305,973 $(17,270) $2,452,175 Total Cash Flows From Financing Activities Effect Of Exchange Rate Changes $1,698,213 $865,637 $1,536,864 $(1,918,335) $795,441 $1,917,253 $(121,833) Change In Cash and Cash Equivalents 14

