Valdosta State University Fact Book 2013-2014
advertisement
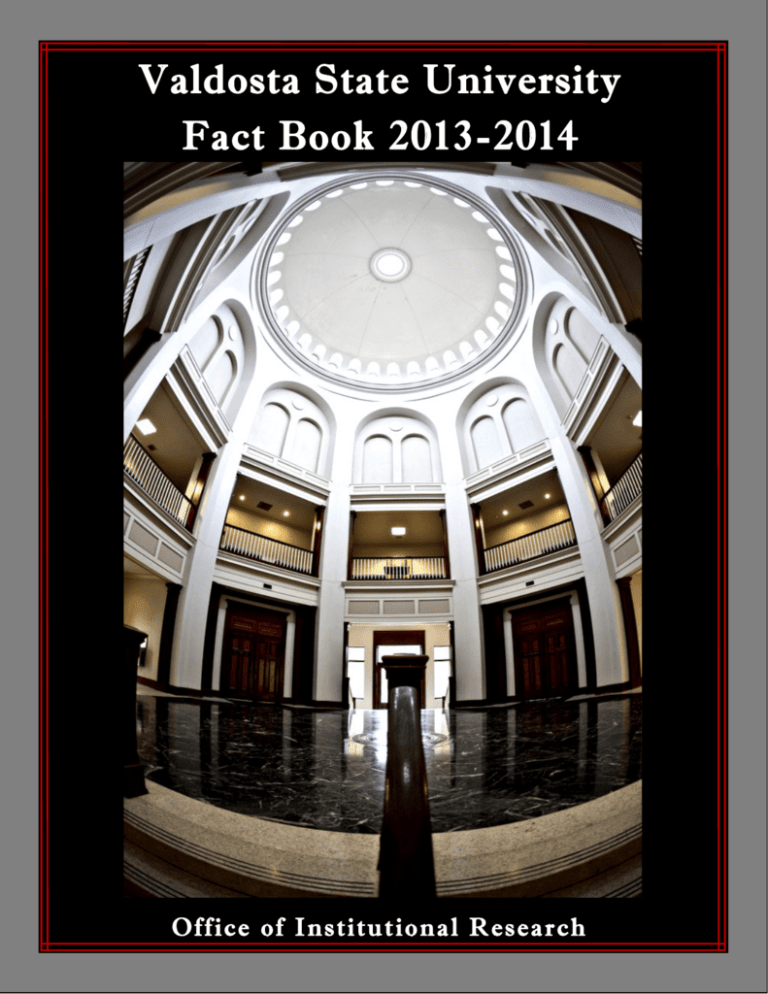
Valdosta State University Fact Book 2013-2014 O f f ic e o f I n s t i t u t io n a l R e s e a r c h VSU Fact Book 2013-2014 Table of Contents ii VSU Fact Book 2013-2014 iii VSU Fact Book 2013-2014 Foreword Welcome to the 25th edition of the VSU Fact Book. The Fact Book is a compilation of commonly requested data and statistical information about VSU. It includes information about students, alumni, faculty, and staff. Information on institutional measures such as admissions, enrollment, retention, graduation, and university finances is also included. The Office of Institutional Research produces this publication annually in an effort to provide reliable and accurate information to the VSU community. We extend our appreciation to all of the University offices that assisted us with the collection and development of this information. For more information on any topics included in this publication, contact: Office of Institutional Research Valdosta State University phone: (229) 333-7831 http://www.valdosta.edu/administration/emc/institutional-research Note: Cover photo courtesy of Flickr. 1 VSU Fact Book 2013-2014 General Information Brief Chronology of Valdosta State University Concise Mission Statement Strategic Goals Board of Regents Membership Board of Regents Organizational Chart VSU Organizational Chart Biography of President Accreditations Degrees and Majors Offered Quick Facts about VSU’s History: Valdosta State College became a Regional University within the University System of Georgia on July 1, 1993; its name was officially changed to Valdosta State University. VSU celebrated its centennial years from 2006 to 2013, marking the institution’s establishment and opening. VSU became a Comprehensive University within the University System of Georgia on July 1, 2013. The six colleges within the University are the College of Arts and Sciences, the Langdale College of Business Administration, the Dewar College of Education & Human Services, the College of the Arts, the College of Nursing & Health Sciences, and the Honors College. VSU’s Graduate School includes the Division of Library and Information Science. VSU offers fifty-six bachelor programs, eleven certificate programs, one endorsement, one diploma seal program, and two associate programs on the undergraduate level and thirty-seven master programs, five education specialists programs, five endorsements, eleven certificate programs, and four doctoral programs at the graduate level. VSU has hosted the Governor’s Honors Program (GHP) since 1980. In 2010, the Commission on Colleges of the Southern Association of Colleges and Schools reaffirmed VSU’s regional accreditation as a part of its 10-year review process. 2 VSU Fact Book 2013-2014 Brief Chronology of VSU A special act by the Georgia General Assembly established an institution of higher learning in Valdosta, Georgia, in 1906. South Georgia State Normal College opened to "young ladies" on January 2, 1913 as a two‐year college specializing in teacher training. An act by the General Assembly in 1922 changed the institution’s name to Georgia State Womans College at Valdosta and authorized a four‐year liberal arts program leading to a bachelor’s degree. In 1950, after 37 years as a woman’s college, the Board of Regents of the University System of Georgia approved the coeducational status and a new name for the institution: Valdosta State College. During the following forty-three years, the school grew exponentially in numbers through expanded undergraduate and graduate degree programs. In 1993, Valdosta State College was named a Regional University by the Board of Regents and became Valdosta State University. As a regional university in South Georgia, VSU collaborates with other University System of Georgia (USG) institutions to provide educational programs to the university's 41-county service region. To expand its programmatic outreach, VSU continues to develop and offer distance learning programs and courses at off‐campus locations throughout Georgia and online. The institution has been led by nine presidents: Richard H. Powell (1913-1933) Jere M. Pound (1933-1935) Frank R. Reade (1935-1948) J. Ralph Thaxton (1948-1966) S. Walter Martin (1966-1978) Hugh C. Bailey (1978-2001) Ronald M. Zaccari (2002-2008) Patrick J. Schloss (2008-2011) William J. McKinney (2012-Present). Source: VSU Archives; VSU Office of the President, 2012. 3 VSU Fact Book 2013-2014 Concise Mission Statement The core characteristics of Valdosta State University include a commitment to excellence and respon‐ siveness within a scope of influence defined by the needs of a specific region of the state and by partic‐ ularly outstanding programs or distinctive characteristics that have a magnet effect even beyond the region. A campus-wide commitment to a technologically enhanced learning community that promotes student success, sustains instructional excellence, serves a diverse and well-prepared student body, offers academic assistance, and provides learning enrichment for all students. A range of disciplinary and interdisciplinary academic programming at the baccalaureate and masters levels, as well as a range of professional programs at the baccalaureate and post-baccalaureate levels, including a limited num‐ ber of professionally oriented doctoral-level programs. A commitment to public service, continuing ed‐ ucation, technical assistance, and economic development activities that addresses the needs, improves the quality of life, and raises the educational level within the university’s scope of influence. A commit‐ ment to scholarly and creative work to enhance instructional effectiveness and to encourage faculty scholarly pursuits and a commitment to research in selected areas of institutional strength and focused on regional need. The expanded mission statement is available at www.valdosta.edu/about/facts/organization-andmission.php. Source: VSU Facts, 2014. 4 VSU Fact Book 2013-2014 Strategic Goals 2013-2019 University Goal 1: Recruit, Retain, and Graduate a Quality, Diverse Student Population and Prepare Students for Roles as Leaders in a Global Society Actively pursue VSU’s Complete College Georgia Plan (CCG). Promote educational excellence in all learning environments through academic, professional, and social opportunities. Improve academic advising and shorten time-to-degree. Create and market an institutional brand identity. University Goal 2: Increase Financial Support for the Institution Increase the number of gifts received and the total dollar amount of gifts raised with a focus on student scholarship support. Increase the total number of donors and the total amount of gifts to the annual fund campaign. Increase the alumni giving rate. Educate faculty and staff about the importance of their gifts and increase the faculty/staff giving rate and the total dollar amount of faculty/staff gifts. Conduct a comprehensive capital campaign. University Goal 3: Promote Student, Employee, Alumni, Retiree, and Community Engagement in our Mission Promote a diversity-rich, student-centered environment by engaging in inclusive social, civic, cultural, professional, and intellectual activities. Develop a campus-wide coordinating infrastructure to secure and provide external recognition for community engagement. Enhance our role as a comprehensive institution and economic leader for South Georgia University Goal 4: Foster an Environment of Creativity and Scholarship Serve as a center for higher education research and development. Increase sponsored research and grants in number and size of awards. University Goal 5: Develop and Enhance Valdosta State’s Human and Physical Resources Prepare all employees to be successful throughout their careers. Elevate service excellence. Engage in concise, inclusive, and purposeful planning Source: Strategic Plan 2013-2019, July 2014. 5 VSU Fact Book 2013-2014 Board of Regents Membership Source: Board of Regents of the University System of Georgia (USG), retrieved April 2014. 6 VSU Fact Book 2013-2014 Board of Regents Organizational Chart Source: Board of Regents of the University System of Georgia (USG), retrieved April 2014. 7 VSU Fact Book 2013-2014 VSU Organizational Chart Source: VSU OIR, 2014. 8 VSU Fact Book 2013-2014 Biography of President A nationally recognized teacher, scholar, and academic leader, Dr. William J. McKinney became Valdosta State University’s ninth president on July 1, 2012. Prior to arriving at VSU, Dr. McKinney served as Vice Chancellor for Academic Affairs and Professor of Philosophy at Indiana University-Purdue University Fort Wayne (IPFW). During his tenure at IPFW, Dr. McKinney led the successful regional reaccreditation by the North Central Association’s Higher Learning Commission as well as the process that led to IPFW’s “Engaged University” designation by the Carnegie Foundation. In his four years at IPFW, sponsored research, grants, and contracts increased by 33 percent. Under his leadership, IPFW also had increases in full-time tenure track faculty, and the percentage of female and minority faculty. In 2010, Dr. McKinney was selected as one of the first 25 chief academic officers to spearhead the “Red Balloon Project.” This project, begun by the American Association of State Colleges and Universities (AASCU), seeks nothing less than to fundamentally re-imagine the role, function, and operation of higher education in the wake of post-2008 budgetary challenges. The Red Balloon Project served as McKinney’s inspiration for the development of the “Re-imagining IPFW’s Academic Future” initiative, an innovative experiment in shared governance where faculty and academic administrators worked collaboratively on strategic priorities ranging from enrollment management to the use of mobile technology. A firm believer of the value of a liberal education, Dr. McKinney has been actively involved with the Association of American Colleges and Universities (AAC&U) since 1994. In 2011, he represented the State of Indiana in the AAC&U’s Quality Collaboratives Project. This collaborative, funded by the Lumina Foundation, seeks to refocus the national higher education dialogue on matters of quality and student learning outcomes by reemphasizing the centrality of faculty and liberal learning. McKinney has been active in the work of the Honor Society Phi Kappa Phi, serving on its board of directors from 2010 -2012, and in various volunteer roles since 2005. He also has been a member of and held leadership positions in a range of local, state, and national organizations, including Northeast Indiana Public Radio, Northeast Indiana Aging and In-Home Services, and the Greater Fort Wayne Chamber of Commerce. McKinney served as the founding Dean of the College of Humanities, Fine and Performing Arts at Slippery Rock University of Pennsylvania from 2001-2008, and as the Chairperson of Philosophy and Religion at Southeast Missouri State from 1997-2001. He received a Ph.D. in Philosophy of Science in 1992 and a M.A. in History and Philosophy in 1989, both from Indiana University-Bloomington. He received a B.S. in Chemical Engineering and a B.A. in History from Bucknell in 1986. He has published or presented well over 100 papers, book chapters or reviews in such diverse topics as the philosophical nature of scientific experiments, environmental ethics, liberal education, and civic engagement. Source: VSU Office of the President, 2014. 9 VSU Fact Book 2013-2014 Accreditation Valdosta State University is accredited or recognized by the following organizations: Commission on Colleges of the Southern Association of Colleges and Schools AACSB International-The Association to Advance Collegiate Schools of Business American Association of School Librarians American Chemical Society American Council on the Teaching of Foreign Languages American Library Association Association for Childhood Education International Association for Educational Communications and Technology Commission on Accreditation for Marriage and Family Therapy Training and Education of the American Association for Marriage and Family Therapy Commission on Accreditation of Athletic Training Education Commission on Collegiate Nursing Education Commission on the Accreditation of Programs in Applied and Clinical Sociology Council for Accreditation of Counseling and Related Educational Programs Council for Exceptional Children Council on Academic Accreditation of the American Speech-Language-Hearing Association Council on Social Work Education Georgia Professional Standards Commission International Reading Association National Association of School Psychologists National Association of Schools of Art and Design National Association of Schools of Music National Association of Schools of Public Affairs and Administration National Association of Schools of Theatre National Council for Accreditation of Teacher Education Public Relations Society of America Source: VSU Undergraduate and Graduate Catalogs, 2014. 10 VSU Fact Book 2013-2014 Degrees and Majors Offered Undergraduate 11 VSU Fact Book 2013-2014 Degrees and Majors Offered Undergraduate Source: VSU Office of Institutional Effectiveness, 2014. 12 VSU Fact Book 2013-2014 Degrees and Majors Offered Graduate 13 VSU Fact Book 2013-2014 Degrees and Majors Offered Graduate Source: VSU Office of Institutional Effectiveness, 2014. 14 VSU Fact Book 2013-2014 Historical Information Total Enrollment Retention Rates Graduation Rates Degrees Conferred Quick Facts about VSU’s Enrollment: 15 From Fall 1992 to Fall 2013, VSU: Increased its enrollment by 4,024 students, which is a 51.2% increase. Experienced a 45.1% growth (3,019 students) in undergraduate enrollment. Increased graduate enrollment 86.5%, which is 1,005 students. Experienced a slight increase of 1.5% in the first-time, full-time freshman one-year retention rate. Experienced an increase of 9.1% in six-year graduation rates from Fall 1992 to Fall 2007. Conferred a total of 43,473 degrees. VSU Fact Book 2013-2014 Total Enrollment Headcount Note: VSU converted from quarter terms to semester terms in 1998. Winter quarter is excluded from the table. Source: USG Semester Enrollment Reports, 1992-2013. Analysis by VSU OIR, 2013. VSU’s Fall 2013 enrollment was 11,885. Note: VSU converted from quarter terms to semester terms in 1998. Winter quarter is excluded from the graph. Source: USG Semester Enrollment Reports, 1992-2013. Analysis by VSU OIR, 2013. 16 VSU Fact Book 2013-2014 Note: VSU converted from quarter terms to semester terms in 1998. Winter quarter is excluded from the graph. Source: USG Semester Enrollment Reports, 1992-2013. Analysis by VSU OIR, 2013. Note: VSU converted from quarter terms to semester terms in 1998. Winter quarter is excluded from the graph. Source: USG Semester Enrollment Reports, 1992-2013. Analysis by VSU OIR, 2013. 17 VSU Fact Book 2013-2014 First-time, Full-time Freshman Retention Rates Source: USG Retention Reports, 1991-2012. Analysis by VSU OIR, 2014. Note: As of Spring 2014, 2 yr, 3 yr, and 4 yr retention rates were unavailable. Rates will be updated when available. The official retention rates track first-time, full-time freshman students. Source: USG Retention Reports, 1991-2012. Analysis by VSU OIR, 2014. Note: As of Spring 2014, 2 yr, 3 yr, and 4 yr retention rates were unavailable. Rates will be updated when available. 18 VSU Fact Book 2013-2014 Undergraduate Graduation Rates Source: USG Graduation Reports, 1992-2007. Analysis by VSU OIR, 2014. The official graduation rates track first-time, full-time freshman students. Source: USG Graduation Reports, 1992-2007. Analysis by VSU OIR, 2014. 19 VSU Fact Book 2013-2014 Degrees Conferred Source: USG Degrees Conferred Reports, 1992-2013. Analysis by VSU OIR, 2014. Source: USG Degrees Conferred Reports, 1992-2013. Analysis by VSU OIR, 2014. 20 VSU Fact Book 2013-2014 Student Information New Student Enrollment Student Residency First-time Freshmen Retention and Graduation Rates Transfer Students Alumni Information New Graduate Students Headcount and Full-time Equivalency Enrollment by Class Level Enrollment by Ethnicity and Gender Enrollment by College Enrollment by Popular Majors Quick Facts about VSU’s Students: 21 Enrollment for Fall 2013 was 11,885, which was a 5.0% decrease from Fall 2012. New students decreased by 7.5%, or 238, from Fall 2012. The student body is a diverse group. Females comprise 61.3% of the student body. Self-declared minorities represent 44.3%. Of VSU’s enrollment, 87.3% of our students are from Georgia. Students came from 155 of the 159 Georgia Counties, 49 states, the District of Columbia, 4 territories, and 68 countries. In FY2013, VSU conferred a total of 2,752 degrees. Georgia is home to 76.3% of alumni. Lowndes (8,926), Thomas (1,455), Gwinnett (1,437), Fulton (1,426), Tift (1,402), Colquitt (1,351), Cobb (1,245), Coffee (1,211), DeKalb (1,149), and Ware (1,048) counties all have more than 1,000 VSU alumni residents per county. VSU’s alumni reside in all Georgia counties, all fifty states, the District of Columbia, and countries throughout the world. There are 56,697 VSU graduates (excluding military) living in the fifty states and the District of Columbia. VSU Fact Book 2013-2014 New Students Enrolled by Classification † Other freshman include non-first-time freshman, such as transfer freshman. In Fall 2010, post-baccalaureate students were separated by undergraduate and graduate level depending on their enrolled program. Source: USG Semester Enrollment Reports, 2004-2013. USG Academic Data Mart, 2004-2013. Analysis by VSU OIR, 2013. †† VSU’s Fall 2013 new student enrollment decreased 7.5% from the prior year. Source: USG Semester Enrollment Reports, 2004-2013. USG Academic Data Mart, 2004-2013. Analysis by VSU OIR, 2013. 22 VSU Fact Book 2013-2014 Admissions of New Freshman† † Freshman includes degree-seeking, first-time freshman only. Source: VSU Admissions Office, 2004-2013. Analysis by VSU OIR, 2013. Source: VSU Admissions Office, 2004-2013. Analysis by VSU OIR, 2013. 23 VSU Fact Book 2013-2014 Mean SAT and ACT Scores of New Freshman † The number of scores may not total the number of new freshman because students can submit both SAT and ACT scores to VSU. Source: USG Academic Data Mart, 2004-2013. Analysis by VSU OIR, 2013. Source: USG Academic Data Mart, 2004-2013. Analysis by VSU OIR, 2013. Source: USG Academic Data Mart, 2004-2013. Analysis by VSU OIR, 2013. 24 VSU Fact Book 2013-2014 Mean High School Grade Point Average of New Freshman †The number of high school GPAs may not total the new freshman because non-traditional and international students are not required to submit high school GPAs. Source: USG Academic Data Mart, 2004-2013. Analysis by VSU OIR, 2013. Source: USG Academic Data Mart, 2004-2013. Analysis by VSU OIR, 2013. New Freshman by Time Status Source: USG Academic Data Mart, 2004-2013. Analysis by VSU OIR, 2013. Source: USG Academic Data Mart, 2004-2013. Analysis by VSU OIR, 2013. 25 VSU Fact Book 2013-2014 22 High Schools with Highest Enrollment of VSU Freshman, Fall 2013 Source: USG Academic Data Mart, 2013. Analysis by VSU OIR, 2013. Source: USG Academic Data Mart, 2004-2013. Analysis by VSU OIR, 2014. 26 VSU Fact Book 2013-2014 Admissions of Transfer Students Source: VSU Admissions Office, 2004-2013. Analysis by VSU OIR, 2013. The number of enrolled transfer students at VSU increased by 22.1% from Fall 2012 to Fall 2013. Source: VSU Admissions Office, 2004-2013. Analysis by VSU OIR, 2013. 27 VSU Fact Book 2013-2014 Transfer Students by Classification Source: USG Semester Enrollment Reports, 2004-2013. Analysis by VSU OIR, 2013. Sophomores and Juniors comprised 77.4% of the transfer students in Fall 2013. Source: USG Semester Enrollment Reports, 2004-2013. Analysis by VSU OIR, 2013. 28 VSU Fact Book 2013-2014 New Graduate Students by Classification Source: USG Academic Data Mart, 2004-2013. Analysis by VSU OIR, 2013. Source: USG Academic Data Mart, 2004-2013. Analysis by VSU OIR, 2013. 29 VSU Fact Book 2013-2014 Mean GRE Scores of New Graduate Students †In 2004, the GRE Analytical Score was changed from a 200-800 scale to 0-6 scale. Source: USG Academic Data Mart, 2004-2013. Analysis by VSU OIR, 2013 Source: USG Academic Data Mart, 2004-2013. Analysis by VSU OIR, 2013. †In 2004, the GRE Analytical Score was changed from a 200-800 scale to 0-6 scale. Source: USG Academic Data Mart, 2004-2013. Analysis by VSU OIR, 2013. 30 VSU Fact Book 2013-2014 21 Previous Institutions of New Graduate Students, Fall 2013 Source: VSU OIR Analysis of USG Academic Data Mart, 2013. Source: VSU OIR Analysis of USG Academic Data Mart, 2014. 31 VSU Fact Book 2013-2014 Total Enrollment and Full-time Equivalent Enrollment Source: USG Enrollment Reports, 2004-2013. USG Academic Data Mart, 2004-2013. Analysis by VSU OIR, 2013. Source: USG Enrollment Reports, 2004-2013. USG Academic Data Mart, 2004-2013. Analysis by VSU OIR, 2013. Source: USG Enrollment Reports, 2004-2013. USG Academic Data Mart, 2004-2013 Analysis by VSU OIR, 2013. 32 VSU Fact Book 2013-2014 Enrollment by Time Status, Fall 2004-2013 Source: USG Academic Data Mart, 2004-2013. Analysis by VSU OIR, 2013. Source: VSU OIR Analysis of USG Academic Data Mart, 2013. Source: VSU OIR Analysis of USG Academic Data Mart, 2013. 33 VSU Fact Book 2013-2014 Enrollment by Classification † In Fall 2010, post-baccalaureate students were separated by undergraduate and graduate level according to their enrolled program. Source: USG Academic Data Mart, 2004-2013. Analysis by VSU OIR, 2014. Undergraduates comprised 81.8% of VSU’s total enrollment for Fall 2013. † Other includes students who were classified as transient, joint enrolled, and other. Source: USG Academic Data Mart, 2004-2013. Analysis by VSU OIR, 2014. 34 VSU Fact Book 2013-2014 Enrollment by Ethnicity and Gender Source: USG Academic Data Mart, 2004-2013. Analysis by VSU OIR, 2013. Females comprised 61.3% of VSU’s total enrollment for Fall 2013. Source: USG Academic Data Mart, 2004-2013. Analysis by VSU OIR, 2013. 35 VSU Fact Book 2013-2014 Enrollment by College ††In Fall 2013, College of Nursing changed to College of Nursing & Health Sciences, and College of Education changed to College of Education & Human Services. †††In Fall 2013, Social Work combined into College of Education & Human Services Source: USG Academic Data Mart, 2004-2013. Analysis by VSU OIR, 2013. Undergraduate Enrollment by College, Fall 2013 Graduate Enrollment by College, Fall 2013 Source: USG Academic Data Mart, 2004-2013. Analysis by VSU OIR, 2013. 36 VSU Fact Book 2013-2014 Enrollment by Time Status, Classification, and College, Fall 2013 Source: USG Academic Data Mart, 2013. Analysis by VSU OIR, 2013. Source: USG Academic Data Mart, 2013. Analysis by VSU OIR, 2013. 37 VSU Fact Book 2013-2014 Enrollment by Residency Source: USG Academic Data Mart, 2004-2013. Analysis by VSU OIR, 2013. Georgia Residents comprise 87.3% of enrolled students. Source: USG Academic Data Mart, 2004-2013. Analysis by VSU OIR, 2013. 38 VSU Fact Book 2013-2014 Enrollment by Georgia Economic Development Region † Lowndes County is included in the Southwest Economic Development Region. Source: VSU OIR Analysis of USG Academic Data Mart, 2013. † Lowndes County is included in the Southwest Economic Development Region. Source: USG Academic Data Mart, 2004-2013. Analysis by VSU OIR, 2013. 39 VSU Fact Book 2013-2014 21 Counties with Highest Enrollment, Fall 2013 Source: VSU OIR Analysis of USG Academic Data Mart, 2014. Enrollment by Georgia County of Residence, Fall 2013 Of the 159 Georgia counties, 155 were represented at VSU in Fall 2013. Source: VSU OIR Analysis of USG Academic Data Mart, 2014. 40 VSU Fact Book 2013-2014 Enrollment by State of Origin, Fall 2013 Source: USG Academic Data Mart, 2013. Analysis by VSU OIR, 2014. Students from Georgia and bordering states comprised 91.5% of VSU’s Fall 2013 enrollment. Note: U.S. Territories are not included in the map. Source: USG Academic Data Mart, 2013. Analysis by VSU OIR, 2014. 41 VSU Fact Book 2013-2014 Enrollment by Country of Citizenship, Fall 2013 Source: USG Academic Data Mart, 2013. Analysis by VSU OIR, 2014. Source: USG Academic Data Mart, 2013. Analysis by VSU OIR, 2014. 42 VSU Fact Book 2013-2014 20 Largest Declared Undergraduate Majors, Fall 2013 Source: USG Academic Data Mart, 2013. Analysis by VSU OIR, 2014. 20 Largest Declared Graduate Majors, Fall 2013 Source: USG Academic Data Mart, 2013. Analysis by VSU OIR, 2014. 43 VSU Fact Book 2013-2014 One-year Retention Rates Source: USG Retention Report, 2003-2012. Note: The official USG Retention rate tracks first-time, full-time students for one year. The USG System-wide retention rates show the percent of students who began at VSU, but later transferred to another USG institution. Source: USG Retention Report, 2003-2012. Analysis by OIR, 2014. 44 VSU Fact Book 2013-2014 Graduation Rates Source: USG Graduation Reports, 1998-2007. Note: VSU graduation rates are based on first-time, full-time students who originally enrolled at VSU and graduated from VSU. System-wide graduation rates are based on first-time, full-time students who originally enrolled at VSU but transferred and graduated from another USG institution. Source: USG Graduation Reports, 1998-2007. Analysis by VSU OIR, 2014. Source: USG Graduation Reports, 1998-2007. Analysis by VSU OIR, 2014. 45 VSU Fact Book 2013-2014 Degrees Conferred by College Source: USG Degrees Conferred Reports, 2004-2013. Analysis by VSU OIR, 2014. Over the last five years, VSU has conferred over 12,449 undergraduate and graduate degrees. Degrees Conferred by College, FY2013 Source: USG Degrees Conferred Reports, FY2013. Analysis by VSU OIR, 2014. 46 VSU Fact Book 2013-2014 Undergraduate Degrees Conferred by College Source: USG Degrees Conferred Reports, 2004-2013. Analysis by VSU OIR, 2014. Source: USG Degrees Conferred Reports, 2004-2013. Analysis by VSU OIR, 2014. Graduate Degrees Conferred by College Source: USG Degrees Conferred Reports, 2004-2013. Analysis by VSU OIR, 2014. Source: USG Degrees Conferred Reports, 2004-2013. Analysis by VSU OIR, 2014. 47 VSU Fact Book 2013-2014 20 Georgia Counties with Highest Alumni Residency Source: VSU Alumni Relations, 2014. Analysis by VSU OIR, 2014. Alumni by Georgia County Source: VSU Alumni Relations, 2014. Analysis by VSU OIR, 2014. 48 VSU Fact Book 2013-2014 Alumni by State of Residence Source: VSU Alumni Relations, 2014. Analysis by VSU OIR, 2014. Source: VSU Alumni Relations, 2014. Analysis by VSU OIR, 2014. 49 VSU Fact Book 2013-2014 Student Services Residence Hall Hall Occupancy Occupancy Residence Financial Aid Aid Awarded Awarded Financial Odum Library Library Collection Collection Odum Quick Facts about VSU’s Student Services: A total of 2,742 students lived in residence halls in Fall 2013, which represents 23.1% of VSU’s total enrollment. Of the students living in residence halls, 61.9% are women. In academic year 2012-2013, 1,785 students applied for financial aid, and 1,496 students (77.3%) were awarded financial aid. The total number of items in the Odum Library collection increased by 47.6% from 1,911,906 in FY2012 to 2,821,213 in FY2013. 50 VSU Fact Book 2013-2014 Residence Hall Occupancy ‡Residence hall was closed for renovation. †Centennial Hall opened in Spring 2005. Source: VSU Housing and Residence Life, 2004-2013. Analysis by VSU OIR, 2014. Of VSU total enrollment for Fall 2013, 23.1% lived in a residence hall. Source: VSU Housing and Residence Life, 2004-2013. Analysis by VSU OIR, 2014. 51 VSU Fact Book 2013-2014 Residence Hall Occupancy by Gender, Fall 2013 Source: VSU Housing and Residence Life, 2013. Analysis by VSU OIR, 2014. Source: VSU Housing and Residence Life, 2013. Analysis by VSU OIR, 2014. 52 VSU Fact Book 2013-2014 Financial Aid Awarded in Academic Year 2012-2013 Source: VSU Financial Aid Office, 2014.Analysis by VSU OIR,2014. Source: VSU Financial Aid Office, 2014. Source: VSU Financial Aid Office, 2014. In Fall 2013, the percentage of degree seeking, first-time freshman who applied for need-based financial aid decreased from 96.4% in Fall 2012 to 92.2%. Source: VSU Financial Aid Office 2014. Analysis by VSU OIR, 2014. 53 VSU Fact Book 2013-2014 Odum Library Collection, Fall 2013 Source: VSU Odum Library, 2013. Source: VSU Odum Library, 2004-2013. Analysis by VSU OIR, 2013. 54 VSU Fact Book 2013-2014 Employee Information Employees by Occupational Area Employees by Time Status Employees by Gender and Ethnicity Faculty by College Instructional Faculty by Tenure Status Full-time Instructional Faculty by Highest Degree Graduate Assistants Quick Facts about VSU’s Employees: Of the 1,718 total employees, faculty comprised the largest portion of the employee population with 36.4% in Fall 2013. From Fall 2012 to Fall 2013, the number of total VSU employees increased 0.8%. Females constituted 54.1% of total employees and 49.0% of full-time instructional faculty in Fall 2013. In Fall 2013, 30.0% of the total employees were self-declared minorities. Fall 2013 percentages by rank of the 486 full-time instructional faculty: 55 Professor: 27.4% Associate Professor: 18.3% Assistant Professor: 34.6% Instructor: 14.8% Lecturer: 4.7% No Rank: 0.2% In Fall 2013, there were 291 graduate assistants employed. VSU Fact Book 2013-2014 Employees† by Occupational Area † Employee data as of November 1, 2013. Source: VSU Human Resources, 2004-2013. Analysis by VSU OIR, 2014. Source: VSU Human Resources, 2013. Analysis by VSU OIR, 2014. 56 VSU Fact Book 2013-2014 Employees† by Occupational Area and Time Status, Fall 2013 † Employee data as of November 1, 2013. Source: VSU Human Resources, 2013. Analysis by VSU OIR, 2014. In Fall 2013, full-time employees accounted for 74.0% of the total employees. Source: VSU Human Resources, 2013. Analysis by VSU OIR, 2014. 57 VSU Fact Book 2013-2014 Employees† by Occupational Area and Gender, Fall 2013 † Employee data as of November 1, 2013. Source: VSU Human Resources, 2013. Analysis by VSU OIR, 2014. Source: VSU Human Resources, 2013. Analysis by VSU OIR, 2014. 58 VSU Fact Book 2013-2014 Employees† by Gender and Ethnicity † Employee data as of November 1, 2013. Source: VSU Human Resources, 2004-2013. Analysis by VSU OIR, 2014. Source: VSU Human Resources, 2013. Analysis by VSU OIR, 2014. 59 VSU Fact Book 2013-2014 Instructional Faculty† by College and Time Status, Fall 2013 † Employee data as of November 1, 2013. Source: VSU Human Resources, 2013. Analysis by VSU OIR, 2014. Source: VSU Human Resources, 2013. Analysis by VSU OIR, 2014. 60 VSU Fact Book 2013-2014 Full-Time Instructional Faculty† by Gender and Ethnicity † Employee data as of November 1, 2013. Source: VSU Human Resources, 2013. Analysis by VSU OIR, 2014. Source: VSU Human Resources, 2013. Analysis by VSU OIR, 2014. 61 VSU Fact Book 2013-2014 Full-time Instructional Faculty† by Tenure Status † Employee data as of November 1, 2013. Source: VSU Human Resources, 2013. Analysis by VSU OIR, 2014. Source: VSU Human Resources, 2013. Analysis by VSU OIR, 2014. 62 VSU Fact Book 2013-2014 Full-time Instructional Faculty† by Highest Degree † Employee data as of November 1, 2013. Source: VSU Human Resources, 2008-2013. Analysis by VSU OIR, 2014. Source: VSU Human Resources, 2013. Analysis by VSU OIR, 2014. 63 VSU Fact Book 2013-2014 Full-time Instructional Faculty† by Gender and Academic Rank, Fall 2013 † Employee data as of November 1, 2013. Source: VSU Human Resources, 2013. Analysis by VSU OIR, 2014. Source: VSU Human Resources, 2013. Analysis by VSU OIR, 2014. 64 VSU Fact Book 2013-2014 Graduate Assistants† by Gender † Employee data as of November 1, 2013. Source: VSU Human Resources, 2004-2013. Analysis by VSU OIR, 2014. In Fall 2013, 66.0% of the graduate assistants employed at VSU were female. Source: VSU Human Resources, 2013. Analysis by VSU OIR, 2014. 65 VSU Fact Book 2013-2014 Financial Information Operating Revenue by Source Non-operating Revenues (Expenses) by Natural Classification Operating Expenditures by Functional and Natural Classification Operating Expenses by Natural Classification Education & General Expenditures per Equivalent Full-time Student Quick Facts about VSU’s Finances: VSU earned 27.1% of its income from tuition and 23.5% from state appropriations in FY2013. Grants and contracts revenue was approximately $2.8 million. Education and general expenditures per student was $10,039. 66 VSU Fact Book 2013-2014 VSU’s Total Sources of Funding, FY2013 Source: VSU Financial Services, FY2013. Source: VSU Financial Services, FY2013. Analysis by VSU OIR, 2014. 67 VSU Fact Book 2013-2014 Operating Revenue by Source Note: The University’s financial reporting presented herein has been adjusted for compliance with Governmental Accounting Standards Board Statements 34 and 35. Additionally, Senate Bill 73 allowed the carryover of certain types of fund in the State of Georgia. Examples include Indirect Earnings from Grants and Contracts and Student Technology Fees. This presentation does not include the activity of these types of funds. Source: Georgia Department of Audits and Accounts, 2013. Source: Georgia Department of Audits and Accounts, 2013. Analysis by VSU OIR, 2014. 68 VSU Fact Book 2013-2014 Non-operating Revenues (Expenses) by Source Note: The University’s financial reporting presented herein has been adjusted for compliance with Governmental Accounting Standards Board Statements 34 and 35. Additionally, Senate Bill 73 allowed the carryover of certain types of fund in the State of Georgia. Examples include Indirect Earnings from Grants and Contracts and Student Technology Fees. This presentation does not include the activity of these types of funds. Source: Georgia Department of Audits and Accounts, 2013. Source: Georgia Department of Audits and Accounts, 2013. Analysis by VSU OIR, 2014. 69 VSU Fact Book 2013-2014 Operating Expenditures by Classification Note: The University’s financial reporting presented herein has been adjusted for compliance with Governmental Accounting Standards Board Statements 34 and 35. Additionally, Senate Bill 73 allowed the carryover of certain types of fund in the State of Georgia. Examples include Indirect Earnings from Grants and Contracts and Student Technology Fees. This presentation does not include the activity of these types of funds. Source: Georgia Department of Audits and Accounts, 2013. Source: Georgia Department of Audits and Accounts, 2013. Analysis by VSU OIR, 2014. 70 VSU Fact Book 2013-2014 Operating Expenditures by Functional and Natural Classification, FY2013 Note: The University’s financial reporting presented herein has been adjusted for compliance with Governmental Accounting Standards Board Statements 34 and 35. Additionally, Senate Bill 73 allowed the carryover of certain types of fund in the State of Georgia. Examples include Indirect Earnings from Grants and Contracts and Student Technology Fees. This presentation does not include the activity of these types of funds. Source: Georgia Department of Audits and Accounts, 2013. Source: Georgia Department of Audits and Accounts, 2013. Analysis by VSU OIR, 2014. 71 VSU Fact Book 2013-2014 Operating Expenditures per FTE † FTE calculation is derived by total student credit hours earned divided by 30 for undergraduate students and 24 graduate students. Source: VSU Finance & Administration, USG Statistics Annual Expenditures, 2013. Source: VSU Finance & Administration, USG Statistics Annual Expenditures, 2013. Analysis by VSU OIR 2014. 72

